Key takeaways:
- Why do traditional spreadsheets fall short for managing multiple projects? Most spreadsheets require manual updates, lack real-time data, and often silo project information. They can’t effectively visualize interdependencies or provide actionable insights, making it harder to manage overlapping timelines, team capacity, and budget usage across a portfolio.
- What are the essential elements of an effective multiproject dashboard? A strong dashboard should display live updates on project status, resource capacity, budget tracking, task ownership, and key deadlines. Customization is key — managers should focus on KPIs that align with strategic goals while filtering out excess data that obscures priorities.
- How can teams build a better multiproject dashboard? Start by defining clear objectives and the metrics that matter most to your goals. Then, use a tool that integrates with your workflows and data sources, supports customizable views, and allows for ongoing optimization as your portfolio evolves. A centralized, automated dashboard is essential for efficient oversight and decision making.
When you manage multiple projects, you need an overview of your timelines, your performance, and the people involved. The dream is a dashboard that pulls the latest data from across your project portfolio and displays it in a way that’s easy to interpret. But despite the number of free project tracking templates you’ll find online, this is easier said than done.
The truth is that a spreadsheet template is no substitute for a custom, real-time management dashboard that monitors multiple projects in one place. Whether you work in your company’s project office or you manage a team with lots of smaller, ongoing projects, you need a better way to manage your timeline, your to-do list, your priorities, and your capacity.
So, in this post, I’ll leave Microsoft Excel at the door and look at how to build a multiple project dashboard that helps you manage your portfolio. I’ll cover:
- The best metrics to monitor in a portfolio dashboard to keep your teams on track to meet your company’s strategic goals
- Examples of dashboards designed for different objectives and different types of project portfolios
- The four steps to using our platform, Wrike, to build a better multiproject dashboard
But first, let’s examine the issues that drive managers to look for a multiple project dashboard in the first place: the areas where spreadsheets fall short, and what you can do instead.
5 reasons to scrap your project management spreadsheets
When you search for any type of project management dashboard online, you’ll be inundated with downloadable Excel templates. Quite frankly, the number of entry-level, free and paid outlines for project schedules, Gantt charts, budget spreadsheets, and goal-tracking is overwhelming — and that’s without mentioning the difference in the quality and functionality they offer.
Managing multiple projects does mean wearing multiple hats, so the number of options makes sense to some extent. But it’s also the core reason why you can’t effectively manage a project portfolio with page after page of cells and formulae.
Spreadsheets can show you some of the angles you need to compare for effective project management. But they’re not transparent, they’re not user-friendly, and they’re not what I’d call a true dashboard — especially not for multiple projects.
Here are the most common complaints:
- Spreadsheets don’t display the latest data on your project progress. They’re often separate from the tools you use to execute your work, and you have to enter data manually, so you can never be sure the “overview” you’re seeing is live.
- Spreadsheets don’t account for project dependencies and overlap. Coordinating interlinking projects is a portfolio manager’s bread and butter. But when you try to do this in a spreadsheet, you’re more likely to duplicate and confuse your data than get the clear visualization you need.
- Spreadsheets can’t monitor all the aspects of your projects in one place. You’ll usually have to switch between tabs or even programs to find information on all your active projects, and every subteam might report differently depending on their preferred methodologies and project management techniques.
- Spreadsheets give you raw data, not insights. Even with the most sophisticated spreadsheet, it’s still up to you to interpret the figures. This makes it harder to anticipate risks to your projects and manage them proactively.
- Spreadsheets silo project information. Because they can become so complex, team leaders may be reluctant to share their spreadsheets or ask their team to work with them directly. This compromises communication and leads to further delays in your projects.
When you oversee multiple projects, you’re the bridge between company-wide strategy and the individual tasks and teams you’re responsible for. The truth is, spreadsheet “dashboards” can make that harder at every turn.
If you’re going to prioritize your deadlines, encourage communication, and allocate your budget and project resources effectively, you need a complete, live overview of your entire portfolio. And for that, you need a true dashboard, customized to your work and your management style.
The best elements to include in a multiple project dashboard
The best multiple project dashboards close the gaps in the system I talked about above. They’re also about customization and translating raw data into a form that helps you do your best work.
Every multiple project dashboard I see is unique, but time and again, project portfolio managers (PPMs) bring together elements like this to build their ideal overview:
- Headline statistics on the number of projects in progress: This gives you an idea of how manageable your workload is and how steadily new projects are being added to your backlog.
- A more detailed view of the project status: The best dashboards often include an easy-to-read chart showing where each project is in its lifecycle or the overall completion percentage for the portfolio or individual projects.
- Alerts for the items that need immediate action: Alongside the total number of projects, managers often include the number of overdue projects so they can take action quickly.
- Capacity statistics: These items show whether a team’s workload is sustainable or if you need to adjust your project plans to stop them from burning out.
- Budget utilization: Managers often use their dashboards to keep an eye on their actual spending or the amount remaining in their portfolio budget, because they’re ultimately responsible for cost overruns.
- A team calendar: This shows upcoming deadlines and milestones more effectively than a simple list of dates.
- Project ownership: When you can instantly see who’s responsible for the different parts of your portfolio, you can delegate resources and manage your people more effectively.
A dashboard is a useful tool because it gives you this crucial data at a glance. It’s your overview, your jumping-off point before you look into specific projects, and one of the most important tools you’ll use for portfolio monitoring.
This means that when you’re choosing the elements to include, it’s important to focus on the information that shows whether you’re on track to meet your objectives, and edit out the streams of data that could potentially cloud your judgment.
Now, let’s see how different managers have achieved this. I’ll show you three examples of clean, goal-oriented portfolio dashboards to support project monitoring, show the manager what’s changed, and help them set their priorities.
3 great examples of multiple project dashboards
1. Executive portfolio dashboard for ongoing status updates
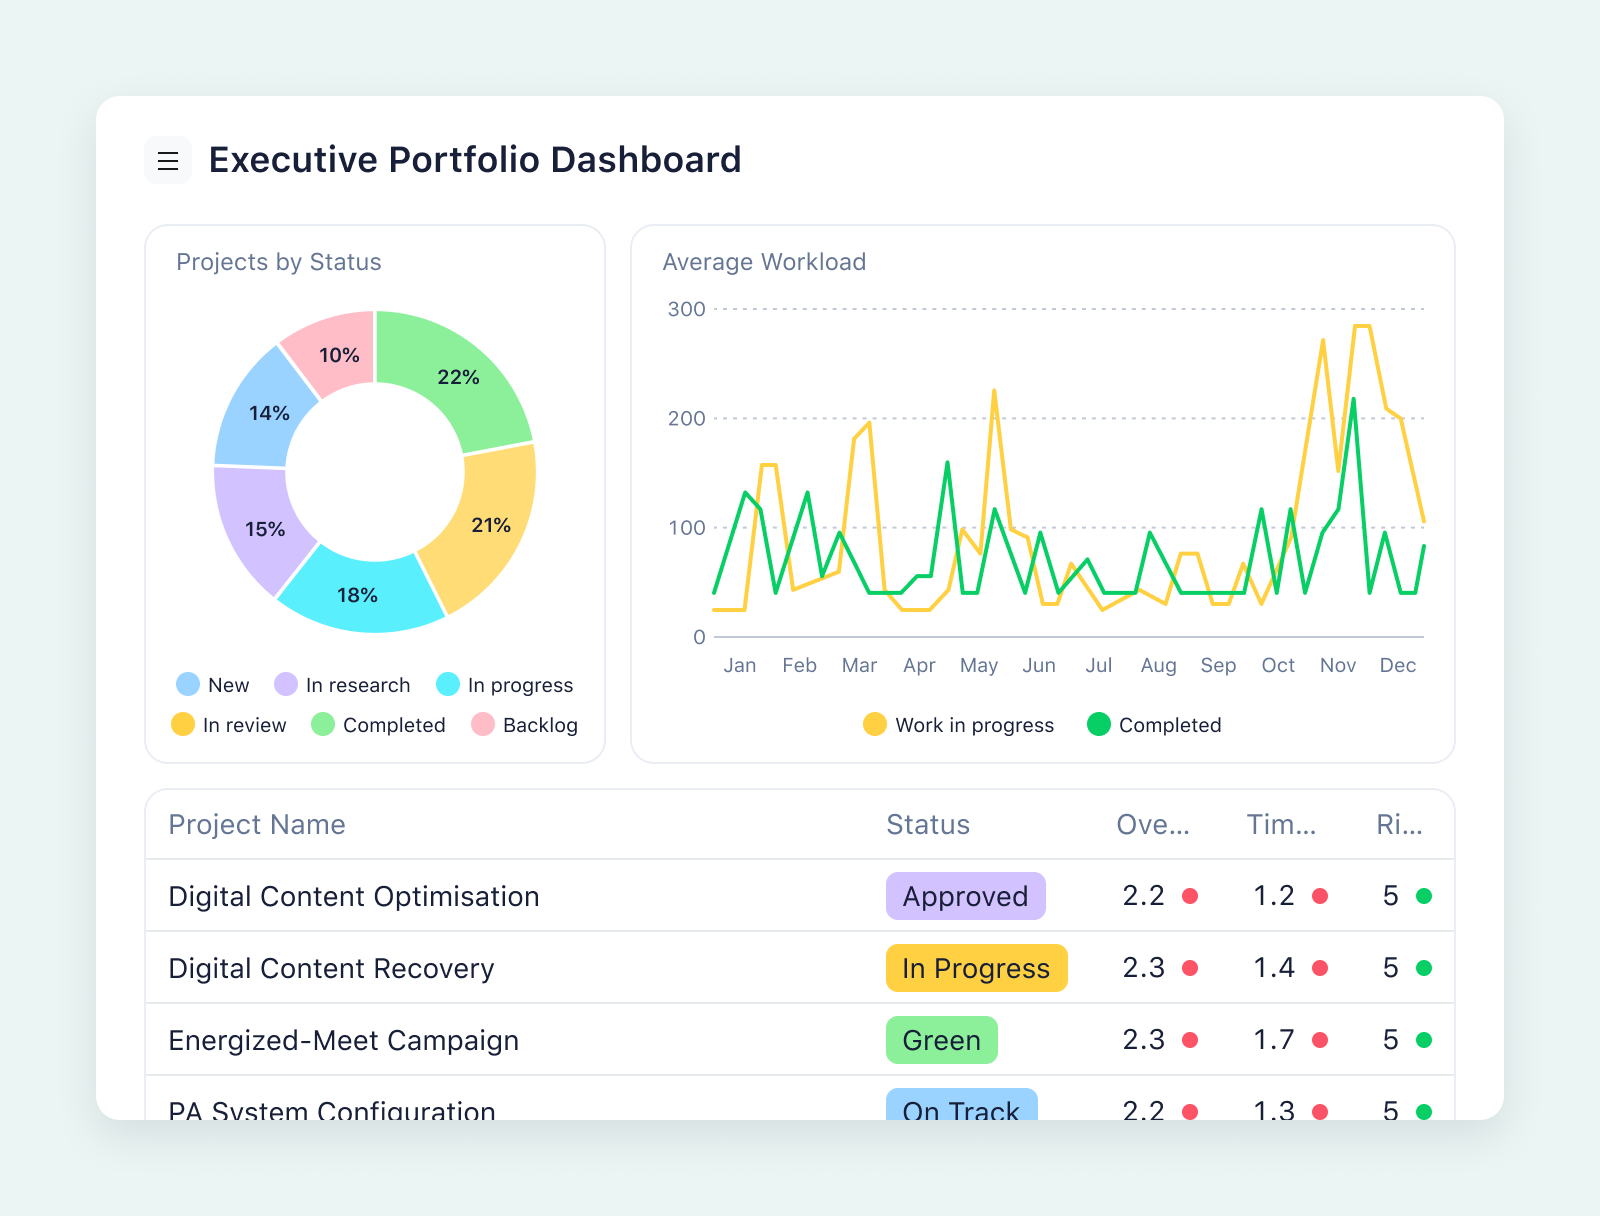
This dashboard has been put together for the company’s project management office (PMO) and for executives to monitor progress and resource allocation for multiple projects at once. It combines multiple project statuses, risk monitoring, capacity planning, and budget information, as well as a color-coded overview of how each team is performing on their current section of the portfolio.
In this dashboard, the chart displaying the planned effort vs. capacity is particularly useful and eye-catching. It instantly shows whether the team is being utilized to its full potential, and whether they have scope to take on more projects. The line-graph format is the ideal way to visualize this information, as it’s far less abstract than a list of percentage points or planned hours in a spreadsheet.
Connected to the team’s capacity, project health is also a key concern here. The dashboard continually analyzes it in three ways: as the overall health of each project, the timing health, and the risk health. This helps the manager or the executives view the team’s workload from more angles, so they can judge their use of resources and their capacity for new work more accurately.
2. OKR-based project dashboard to track portfolio finances
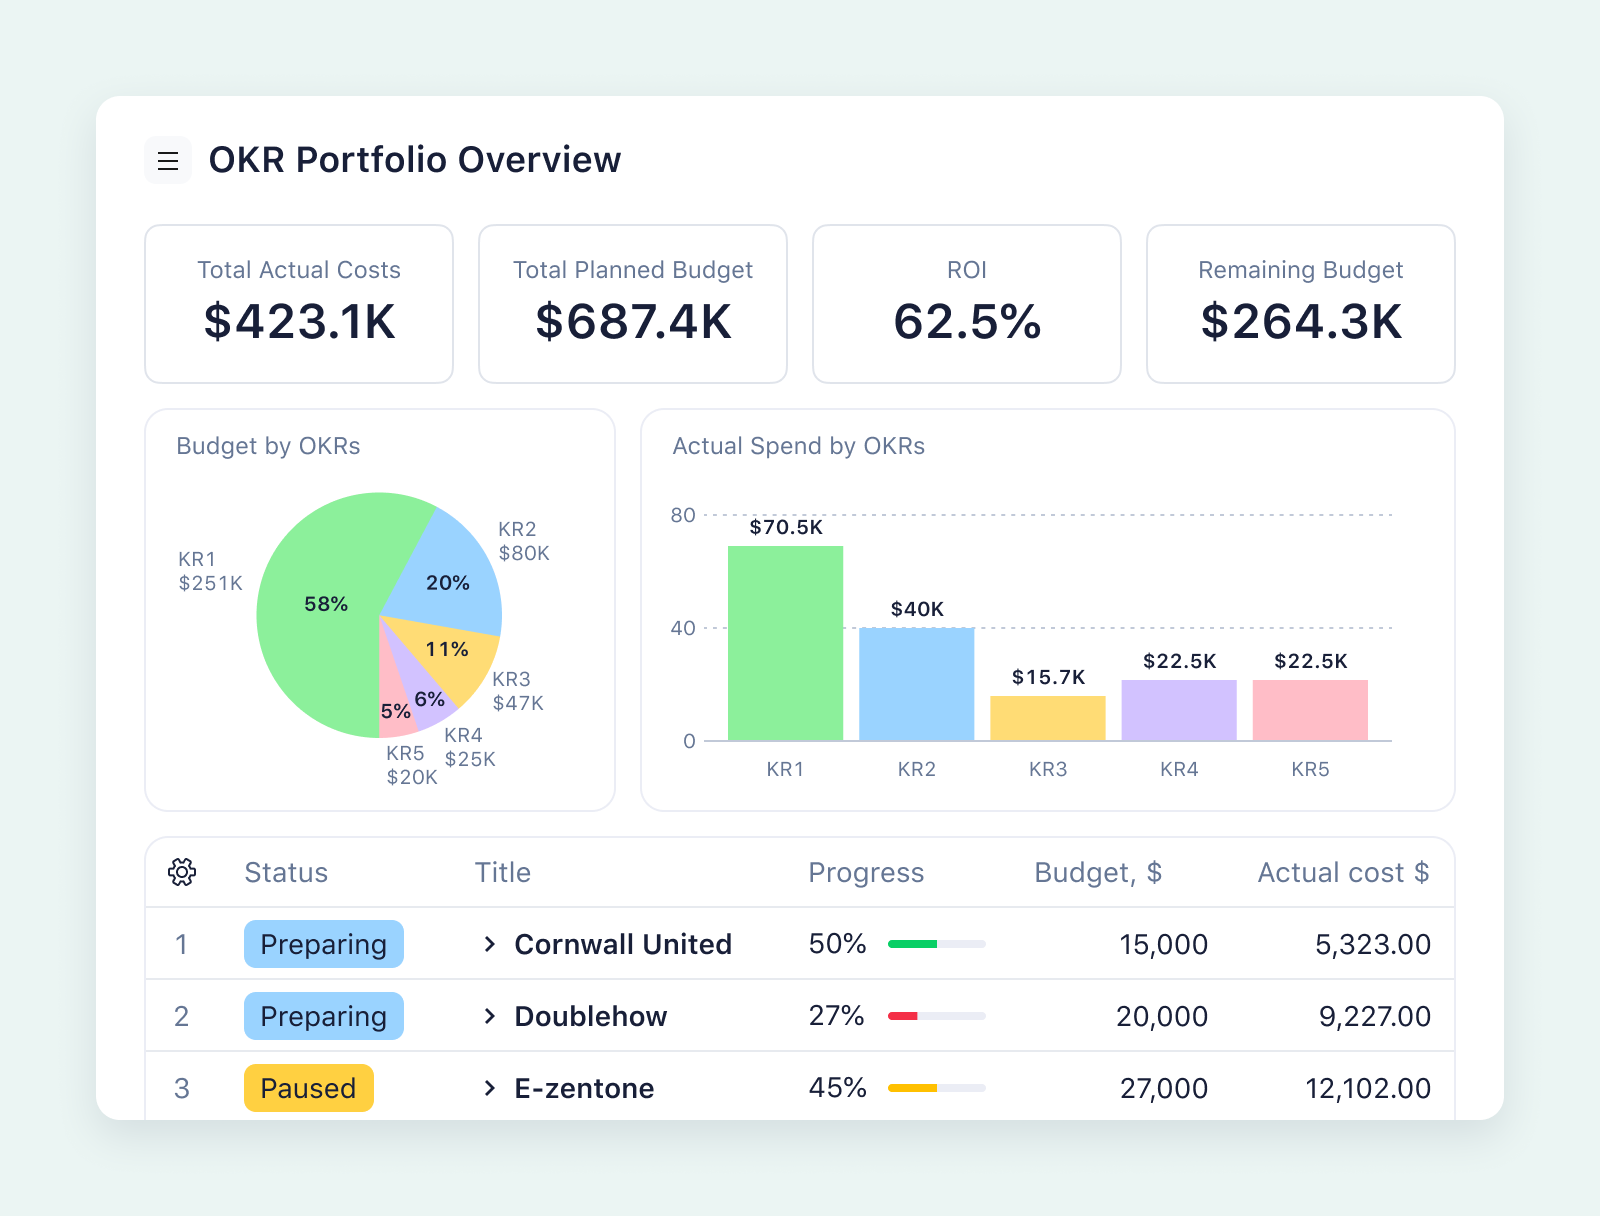
By showing the actual costs, the planned budget, and the remaining budget side by side, the manager keeps the latest financial information in view. This helps them to keep their overall project costs down, account for the spending, and maintain a clear understanding of how the portfolio funds have been shared out.
To report on financial OKRs more efficiently, this dashboard also includes the headline information on each project’s current status and progress, so the manager has a deeper understanding of what needs to be achieved with the remaining budget.
As above, the selection of graphs and progress bars makes this information far easier to interpret — and far easier to share with executives or other stakeholders — than a spreadsheet dashboard template ever could.
3. Project team board to boost accountability
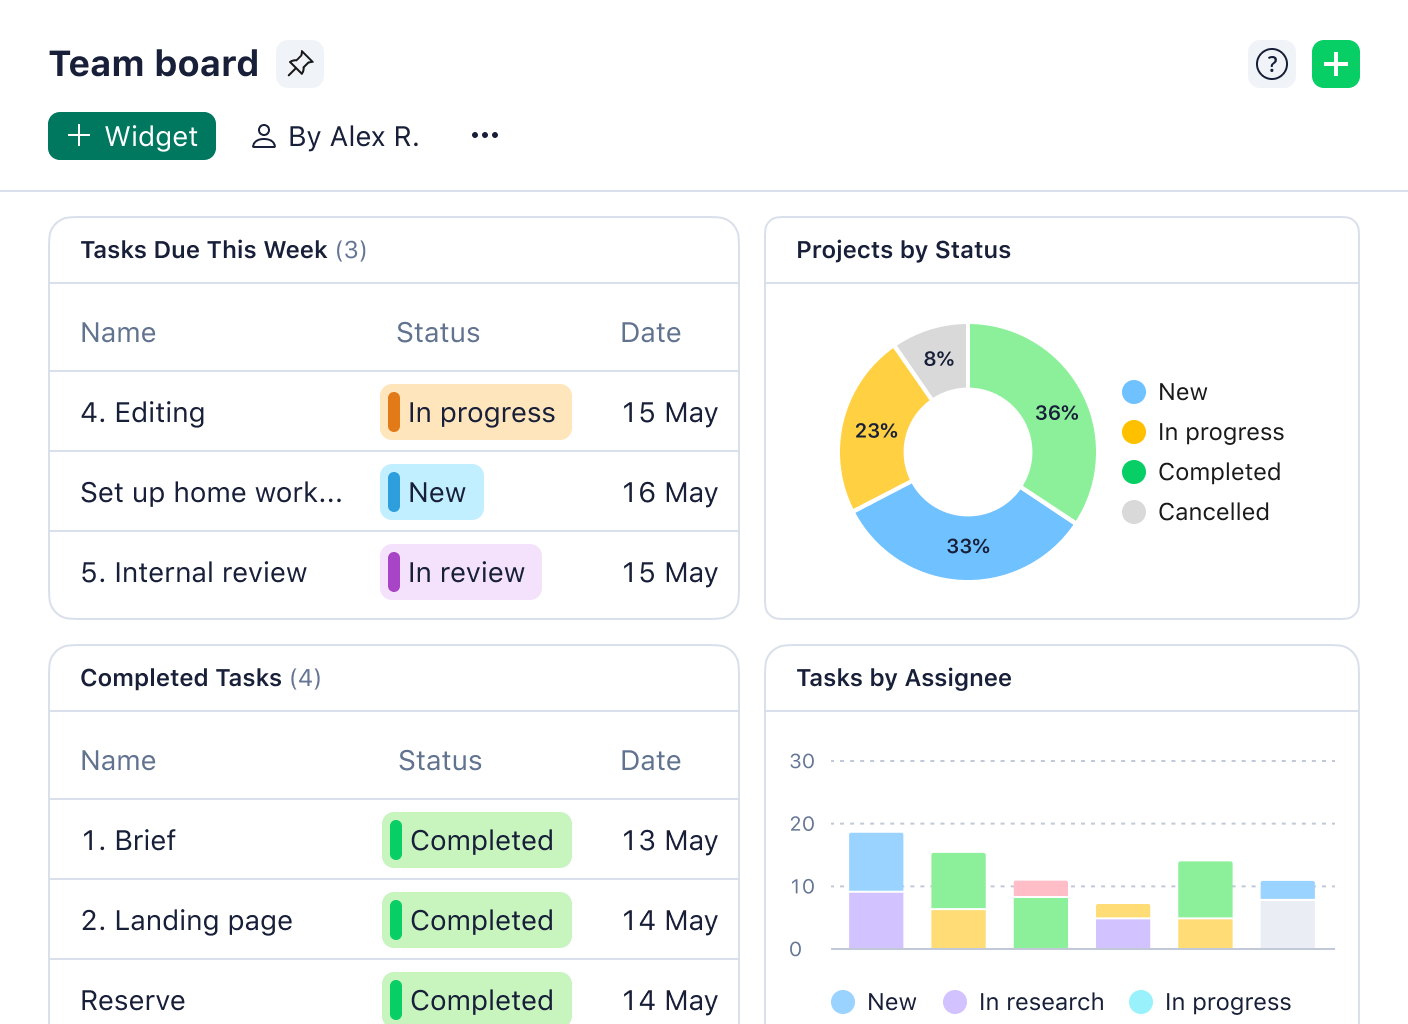
This dashboard is designed around the needs of the portfolio manager to give them an instant overview of their team’s progress, a reminder of the project timelines, and an idea of where their input will be needed next.
Here, the manager has chosen project tracker widgets to highlight the to-do list and to show the percentage of the portfolio tasks that have been marked complete. Helpfully, the dashboard also breaks those completed, in progress, new, and canceled tasks down by assignee, so the manager can identify the team members who need more support. For example, if a new task comes in, the bar chart shows that it can be assigned to the team member who has had the majority of their tasks canceled.
The dashboard area showing the upcoming deadlines and milestones is also useful for multiple project management. It helps the manager prioritize their tasks and plan their week, especially if they have a role in the approval workflow and need to set aside time to review the work.
All these dashboards have been generated automatically and updated in real time by project teams who work in Wrike.
Wrike is a complete, intelligent, scalable work management system for even the most complex project portfolios.
With our platform, you build powerful, automated dashboards by combining widgets that display the latest information from your project teams — even if they work in completely different areas of your company. This puts the information you need to monitor your work at your fingertips, whatever your management style and whatever your goals for your projects.
How to build a multiproject dashboard in Wrike
Once you start tracking your project tasks in Wrike, it’s incredibly easy to build a dashboard to keep you updated.
Step 1: Define the dashboard objectives
When you manage a portfolio instead of a single project, you’re responsible for aligning that work with your company’s wider strategic goals. So, the first step toward building your multiple project dashboard is to revisit those goals and identify the KPIs that will show whether your projects are on track.
For example, if you’re managing the portfolio with a view to increasing operational efficiency, you might add a dashboard widget to display your current operating expenses alongside your budget for the quarter. This will help you to keep a close eye on your margins and show you how likely you are to meet the targets you’ve been assigned.
Or, imagine your company is focused on increasing its customer satisfaction scores. In this case, you might choose metrics that show whether you’re delivering your projects on time and on budget or highlight upcoming client calls so you can schedule meetings with your team to prepare for them in advance.
Step 2: Add a dashboard to your Wrike workspace
To add a dashboard to your Wrike space, simply open the tools option in the sidebar, select dashboard from the list, and select the widgets you want to include. You’ll find a list of options to choose from, including:
- Upcoming tasks, including your personal tasks, the tasks for the week, and the full task and project lists for the portfolio
- Project and task counts, to show the total volume of work you’re monitoring
- Progress trackers, to show the percentage of completed tasks or projects and tasks by status
- Burndown charts, to show how your team is progressing through the project in comparison to the project plan
- Assignee information, to show which members of your team are responsible for which tasks
You can also add a custom widget, built from scratch, to analyze your project data from another angle. Or, use a Wrike template for project portfolio status to create your dashboard — as well as other overviews like Gantt charts — in seconds.
In some cases, you might want to share your dashboard with your teammates to keep them in the loop and show them how their work fits into the bigger picture. Often, though, you’ll want your portfolio dashboard to stay under wraps. To protect the sensitive information in your dashboard, simply adjust the access roles in your workspace so the portfolio dashboard is only visible to you and your executives.
3. Integrate your tools
Once your project management system is up and running, you’ll find countless opportunities to integrate the tools your team uses to complete their project work. Whenever you integrate another tool with Wrike, you close a gap in your process and make your project monitoring more efficient. This is another clear advantage over generic templates and spreadsheet dashboards.
For example, to improve your financial overview, you can integrate a tool like QuickBooks to keep your portfolio budget up to date and make your dashboard even more accurate. Or, for a more comprehensive view of your project statuses, you can integrate the tools you use to proof and approve your deliverables, to power your review process, and to move tasks to the end of your workflows more smoothly.
Wrike’s workflow automations and integrations are a feature of our groundbreaking WorkIntelligence AI. Find out more here: Wrike’s Work Intelligence: The smart solution for any workflow.
4. Launch and optimize your dashboard
As you start to use your dashboard to monitor your portfolio, you’ll notice areas where it improves your multiple project management, and other areas where you still see potential.
Once again, the beauty of Wrike is the customization. If you notice an area where you’d like a more detailed overview of your results, add another widget. If your company amends its strategic goals, adjust the KPIs you track. And if you run into a conflict with a particular client on your roster, you can foreground the metrics you want to concentrate on until the problem is resolved.
When you manage multiple projects, reporting and monitoring are ongoing processes, not finite tasks. But when you use Wrike to oversee your portfolio, you can optimize your dashboard at any time, without disrupting your overview or the flow of work.
Transform your management dashboards from Wrike
Wrike doesn’t just provide project dashboard tools; it offers a way to transform every aspect of your project management. At every stage of your workflow, you can use our suite of features to make your work more efficient, to improve collaboration within your team, and to ground your decisions in real-time project data.
Prioritize projects across your portfolio
From the first concept meetings to final approval, Wrike keeps every task in every project in full view. With this complete overview, you can examine your work from every angle. And because there’s no risk of a project task falling through a crack in your system, you can inform your decisions and prioritize your tasks however much your workload grows.
Wrike comes with countless features for accurate task management, including:
- Automated request forms to simplify intake and add new projects, complete with their tailored workflows, to your backlog
- Custom workflow stages and statuses for accurate progress reports and scheduling
- Dynamic project scheduling, including automated task dependencies to keep your calendars and Gantt charts up to date
Technology company Hootsuite started using Wrike when its team expanded to 16 offices across time zones. Now, its teams use dashboards to centralize all their projects, and Wrike’s project folder and management features to locate the information they need in seconds.
With Wrike, I am able to track and monitor of all my projects in one place. If asked about one of my projects, I can instantly go into Wrike and give them an update within 30 seconds.
Lisa Matthews, Project Manager
Execute tasks with ease
Working on multiple projects means coordinating multiple teams and departments. However much this workload grows, Wrike’s project management software is scalable and secure. Not only can your space expand to cover all the different tasks your work involves, but we also make it easier to manage complex, overlapping projects as your portfolio grows.
Wrike is a centralized space where all the communication and discussions around your projects can take place — or, as many of the companies that work in Wrike put it, “If it’s not in Wrike, it doesn’t exist.” This central source of truth keeps teams organized and accountable as their portfolio grows.
As well as simply storing your essential project files and saving your discussions, Wrike removes many of the challenges of executing projects across different teams. Features like cross-tagging make it easier to share resources without duplicating them, and communication tools like @mentions call a team member’s attention to a task as soon as their input is needed.
For advertising agency Ogilvy Australia, Wrike’s communication and task management tools help execute successful projects for a wide range of international clients. From clarifying processes around intake and approvals to dashboards that make the latest project information continually accessible to their teams, Wrike has brought transparency that helps them deliver their best work.
Everything I see in Wrike is now live and in its current status, which is a big plus to me. We can jump on the job, look at the last couple of comments on it, and pick the ball up and run with it from there.
Ashley Risstrom, Senior Production Manager
Assign project resources effectively
Wrike includes a range of tools to help you monitor resource use across your portfolio and make informed decisions about assigning teams to incoming work.
I’ve already discussed Wrike’s integration with QuickBooks as a way to improve financial management for your ongoing projects. Wrike also includes tools like an employee time tracker and templates for budget tracking. You can set up automated risk alerts when individual projects are at risk of overrunning their budget, and save all the information around your portfolio finances for easy access when you audit your work in the future.
Alongside your project’s finances, Wrike also helps you make smarter decisions about allocating resources and delegating new tasks. 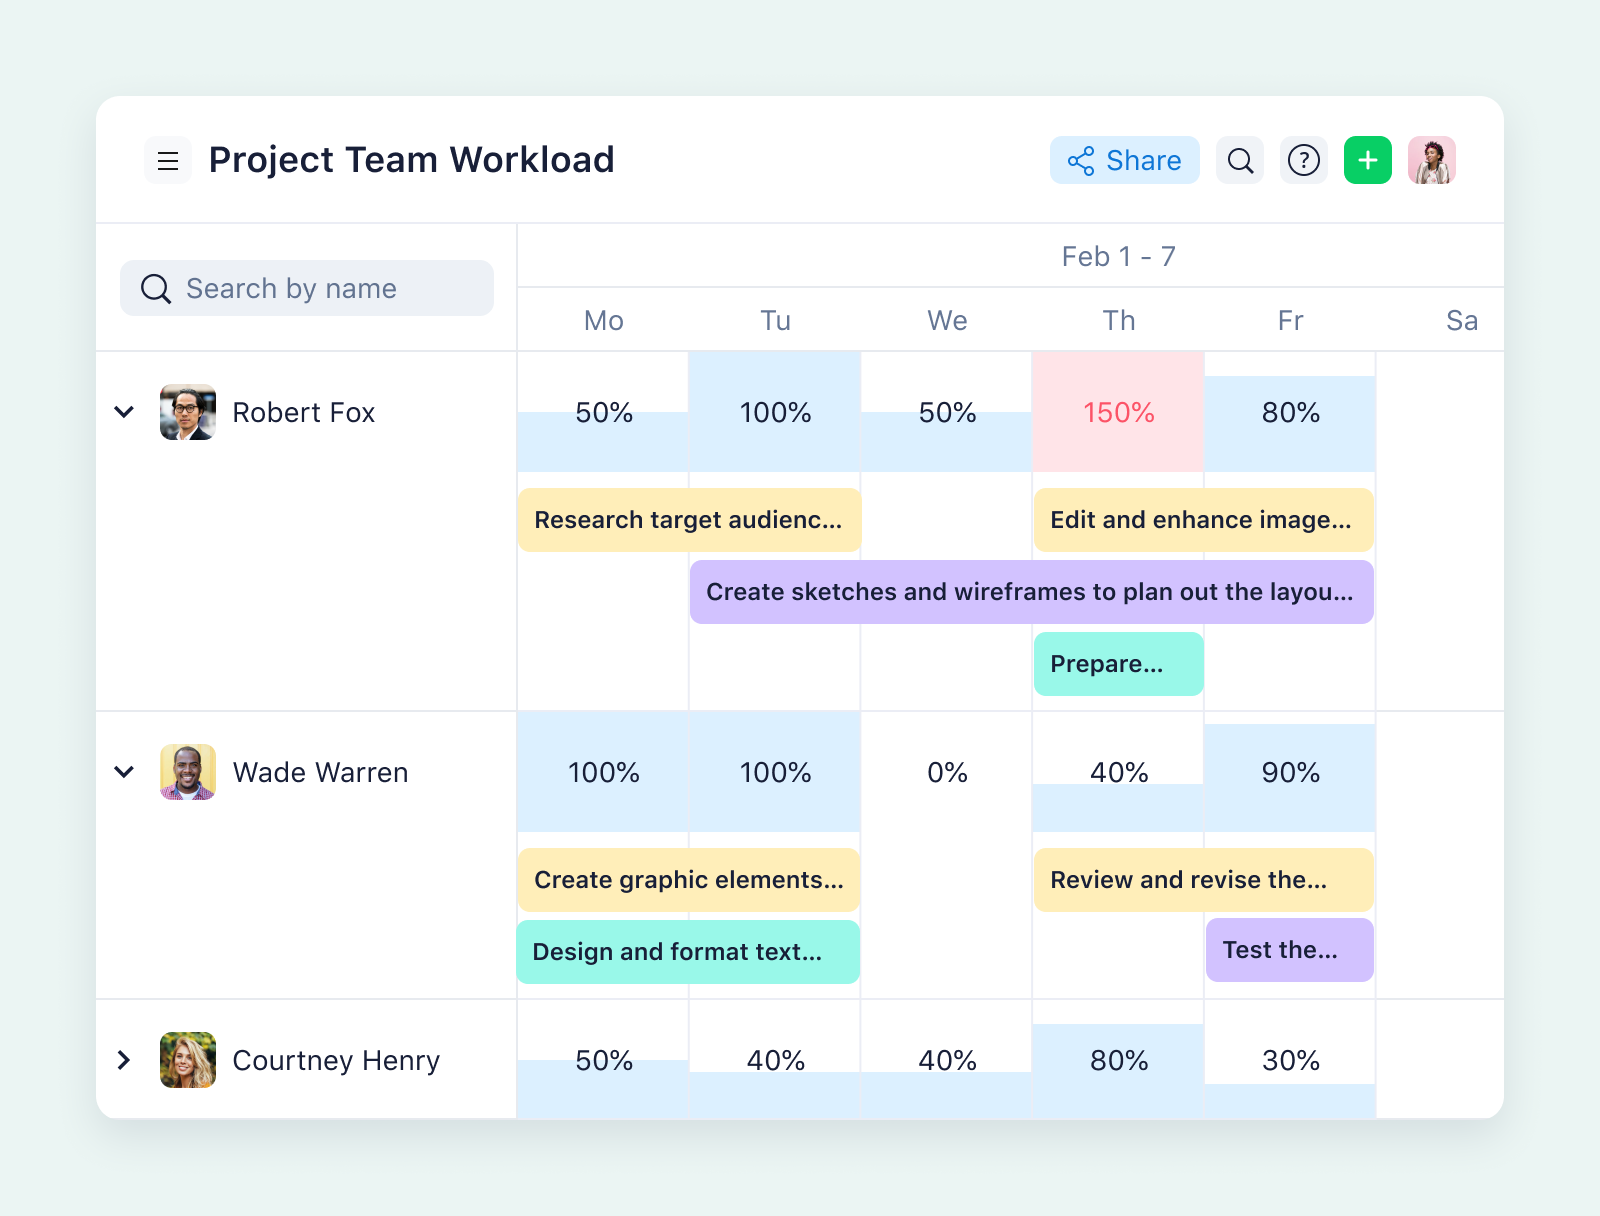
For example, you can use our capacity management software to monitor your team’s workload and organize their schedules. By adding a capacity view to your project management space, you can instantly identify the team members who have the bandwidth for new work and reassign tasks if a team member goes over their available hours.
Telecommunications company Arvig uses Wrike across its distributed teams. Their HR team saves 900+ hours a year by tracking their workflows in Wrike, and they’ve reduced their project costs by 20% on average.
Monitor your progress in detailed reports
If your dashboard is your bird’s-eye view, the reports you generate with Wrike drill down into the granular data. With reports, you gain insights into why your projects are at a certain status, why they’re burning down in a certain way, or why your number of overdue projects has changed since the last time you checked.
Just as you’d customize a widget for your dashboard, you can filter your project data into concise, shareable reports and automate Wrike to send them straight to your inbox. This gives you another valuable tool to support your project management decisions, and helps you allocate resources, communicate with your team, and prove your results throughout your project.
Plus, with Wrike, you can access all this information on the go, with a mobile project management app that allows you to access your dashboards and reports anytime, anywhere. 
I can’t live without reporting. I can pull a report and within minutes I can pivot it any way I want to without exporting it to Excel. We’re able to get things done faster than we have in any other year.
Patricia Davis, PMO Manager
Adapt to your project management methodology
I’ve already spoken about how to customize your project management dashboard to fit the way you work. With Wrike, your teams have the same level of flexibility and control in their workspaces. And whatever their preferences as they build out their space, you’ll still have that real-time overview of how their progress feeds into your wider portfolio. 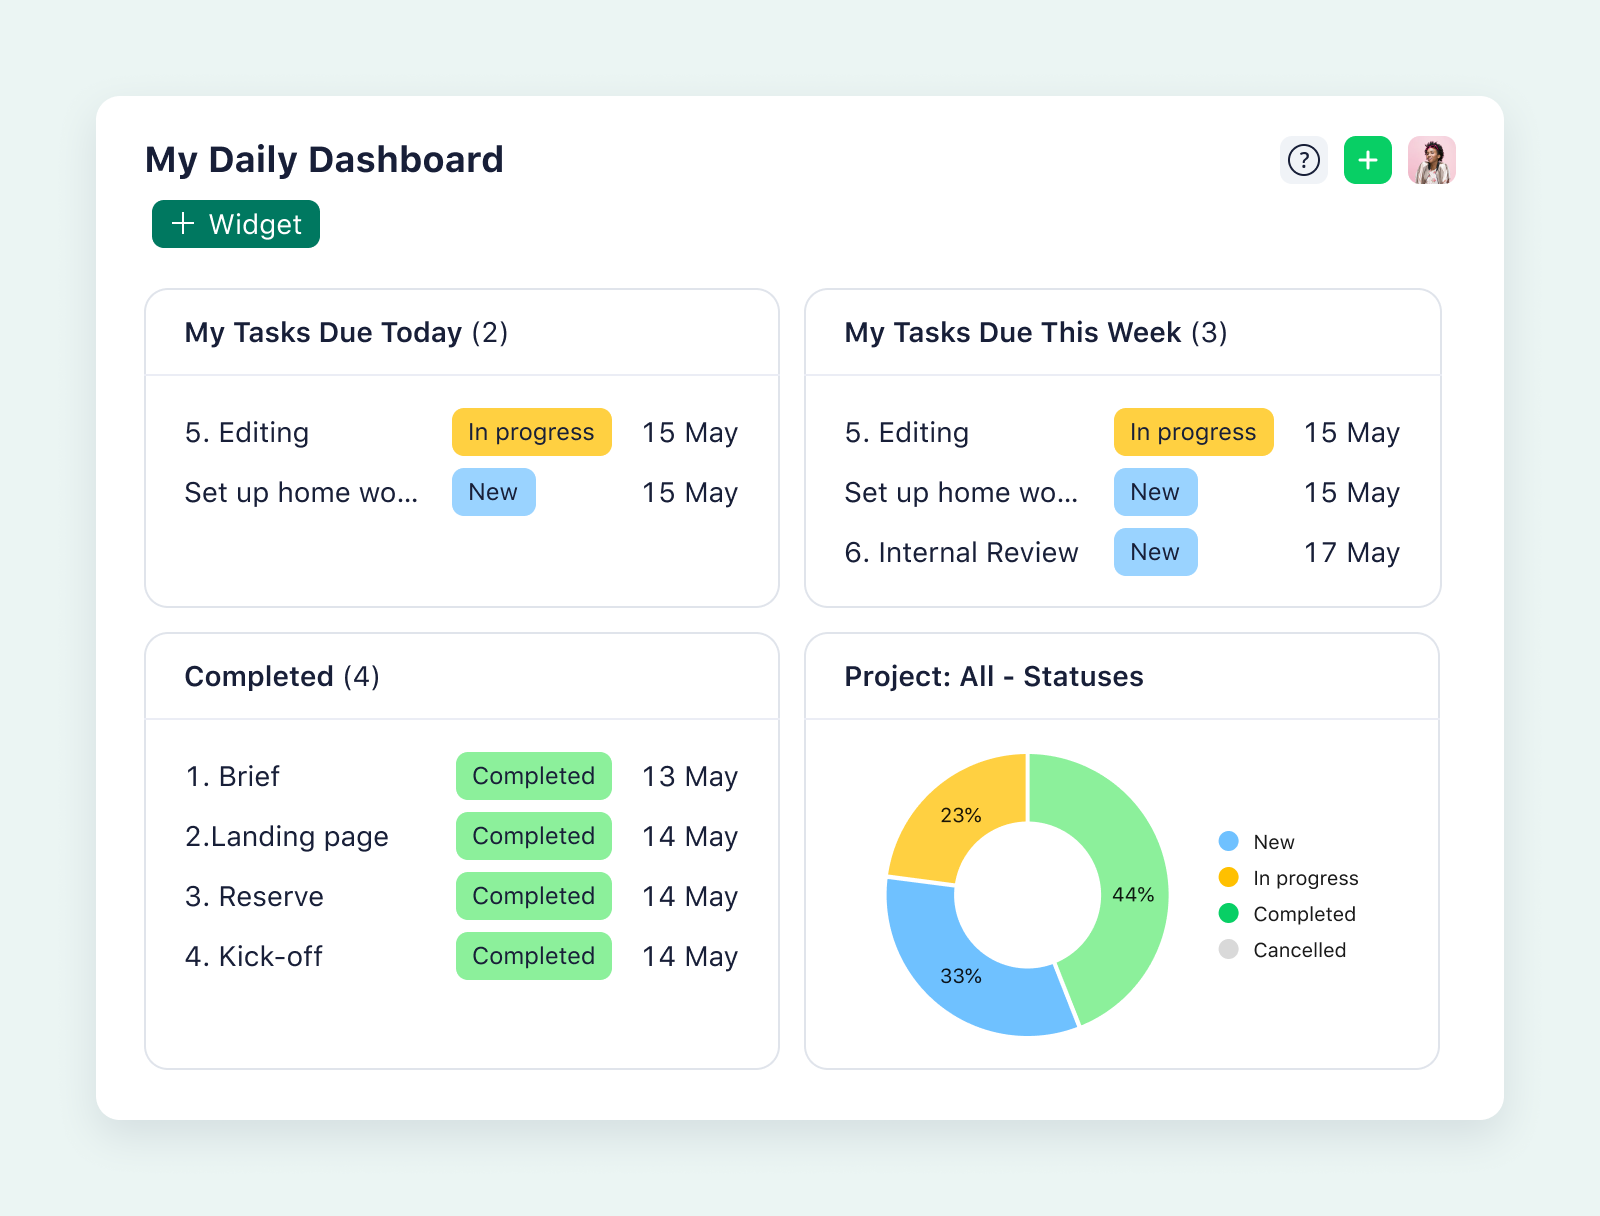
Our template library includes options for Agile, Waterfall, and hybrid project management methodologies, all of which can be tailored to your tasks and your process.
Multiple projects, one powerful dashboard
In this post, I’ve covered all the features you can expect from the most powerful multiproject dashboards. With Wrike’s project management software, you can easily develop and perfect your portfolio overview, however many projects you have.
When you’re looking for a custom, scalable dashboard for your ongoing projects, choose Wrike. Find out more about our dashboard and project management features now.


