Key takeaways:
- How does advanced project management software handle dependencies? It automatically shifts all related timelines when a task changes, preventing manual recalculations and keeping project schedules accurate.
- How can it help avoid hidden conflicts and deadline surprises? By proactively detecting dependency violations and flagging scheduling conflicts before they affect delivery — even across teams and milestones.
- Why is reusable dependency logic important for recurring projects? Templates that preserve dependency structures eliminate the need to rebuild workflows from scratch and ensure reliable timelines every time.
Every project management tool claims it handles task dependencies. But there’s a massive difference between having dependency features and solving dependency challenges at scale.
When you’re managing complex projects with multiple teams, the most basic dependency tracking can actually create more work:
- Delays that require manual timeline recalculation: When one task shifts, you end up spending hours updating dependent tasks across your Gantt chart
- Hidden scheduling conflicts that surface too late: You schedule a task to start, but it depends on another task that isn’t finished yet — your team discovers the conflict only when they’re about to begin
- Spending hours recreating project workflows you’ve run before: Rebuilding dependency chains from scratch each time you run a recurring project type
- Finding out too late that another team’s delay just pushed your deadline: Cross-team dependencies stay hidden until they cause problems
The tools that merely display dependencies leave you managing these problems manually. But the tools that solve dependency challenges handle them automatically.
Wrike takes the latter approach. Our dependency management combines automated rescheduling, proactive conflict detection, and template logic preservation to eliminate the busywork that other platforms create.
In this post, I’ll show you how Wrike’s dependency features work — and why they’re built for projects where dependencies matter.
Dependency visualization with Gantt charts
Wrike’s interactive Gantt charts provide real-time visibility into task dependencies, showing how work is connected and where bottlenecks might emerge.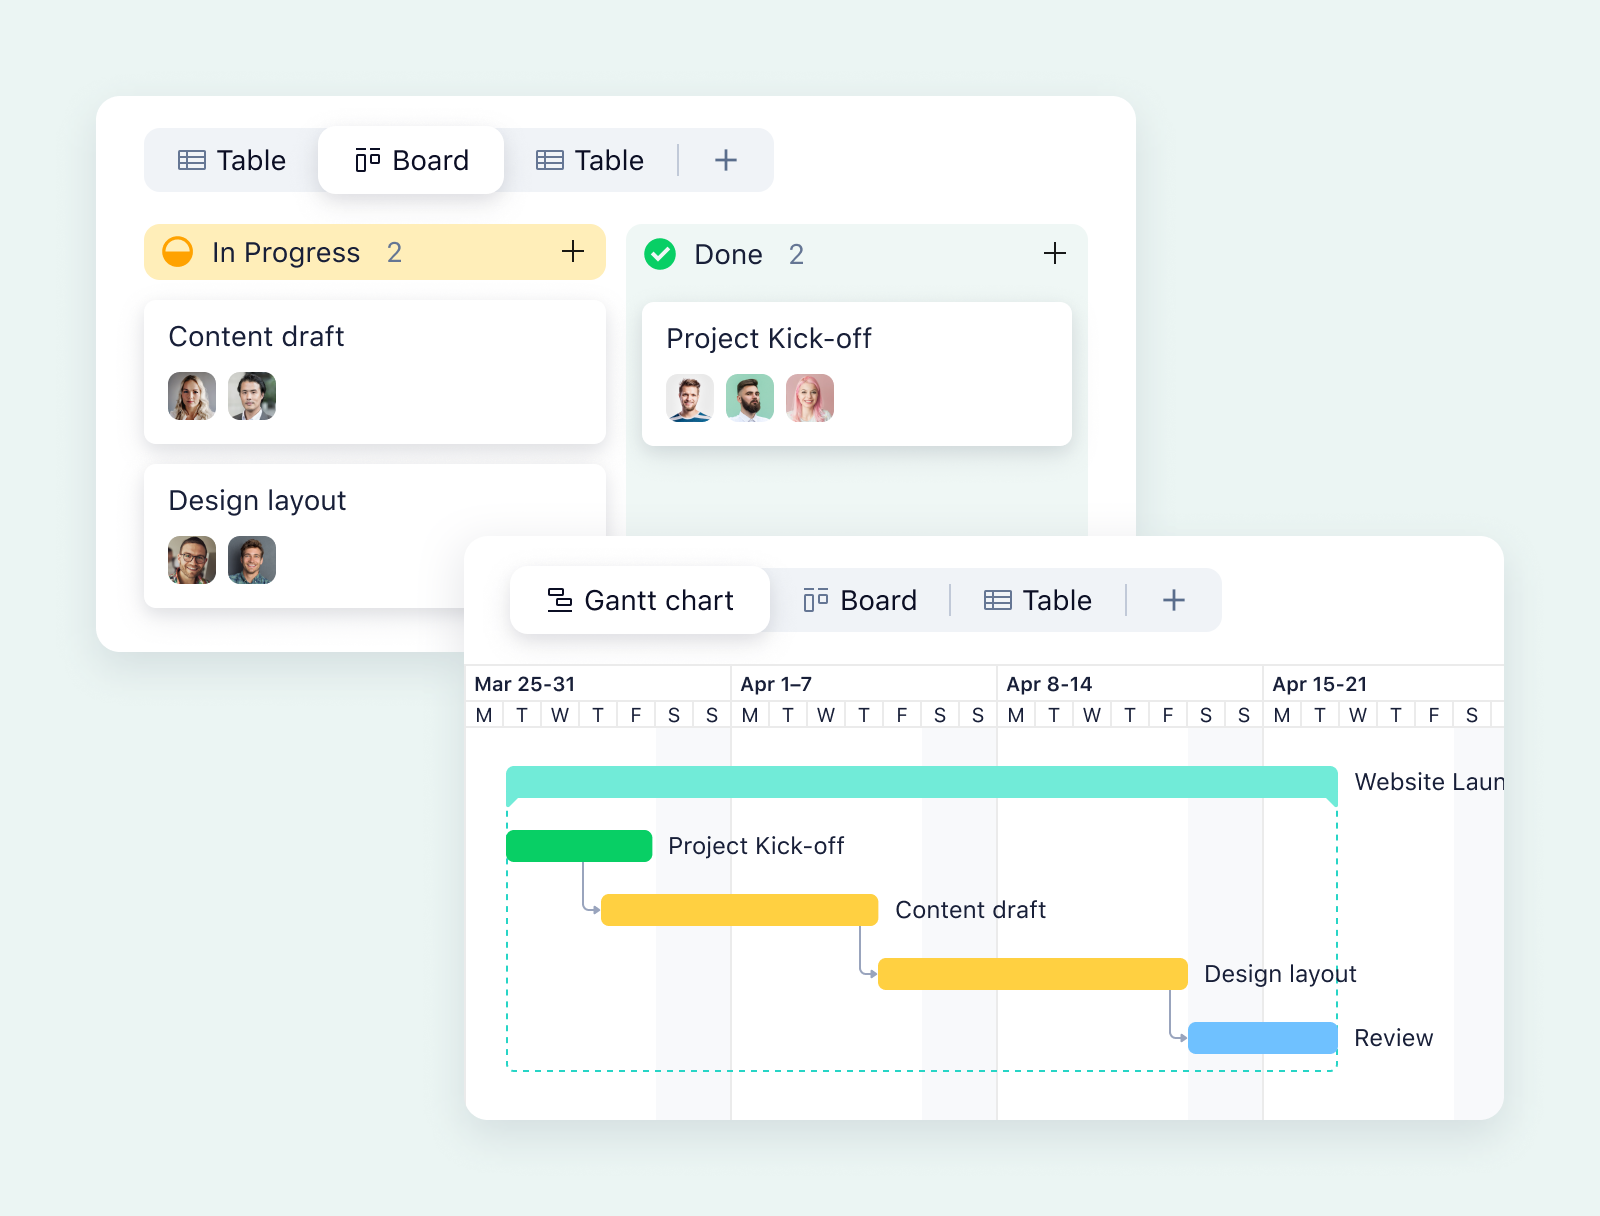
Say you’re managing a content marketing campaign where:
- Blog posts can’t start until brand guidelines are approved
- Social media assets and email newsletters also need those same brand guidelines
- Blog posts must finish before social promotion begins
On Wrike’s Gantt chart, you’d see the brand guidelines task with three dependency lines flowing from it to the blog, social, and email tasks, which run in parallel. Then, another dependency line flows from blog posts to social promotion. This visual map immediately reveals that brand-guideline approval is your critical bottleneck — it’s blocking three separate workstreams.
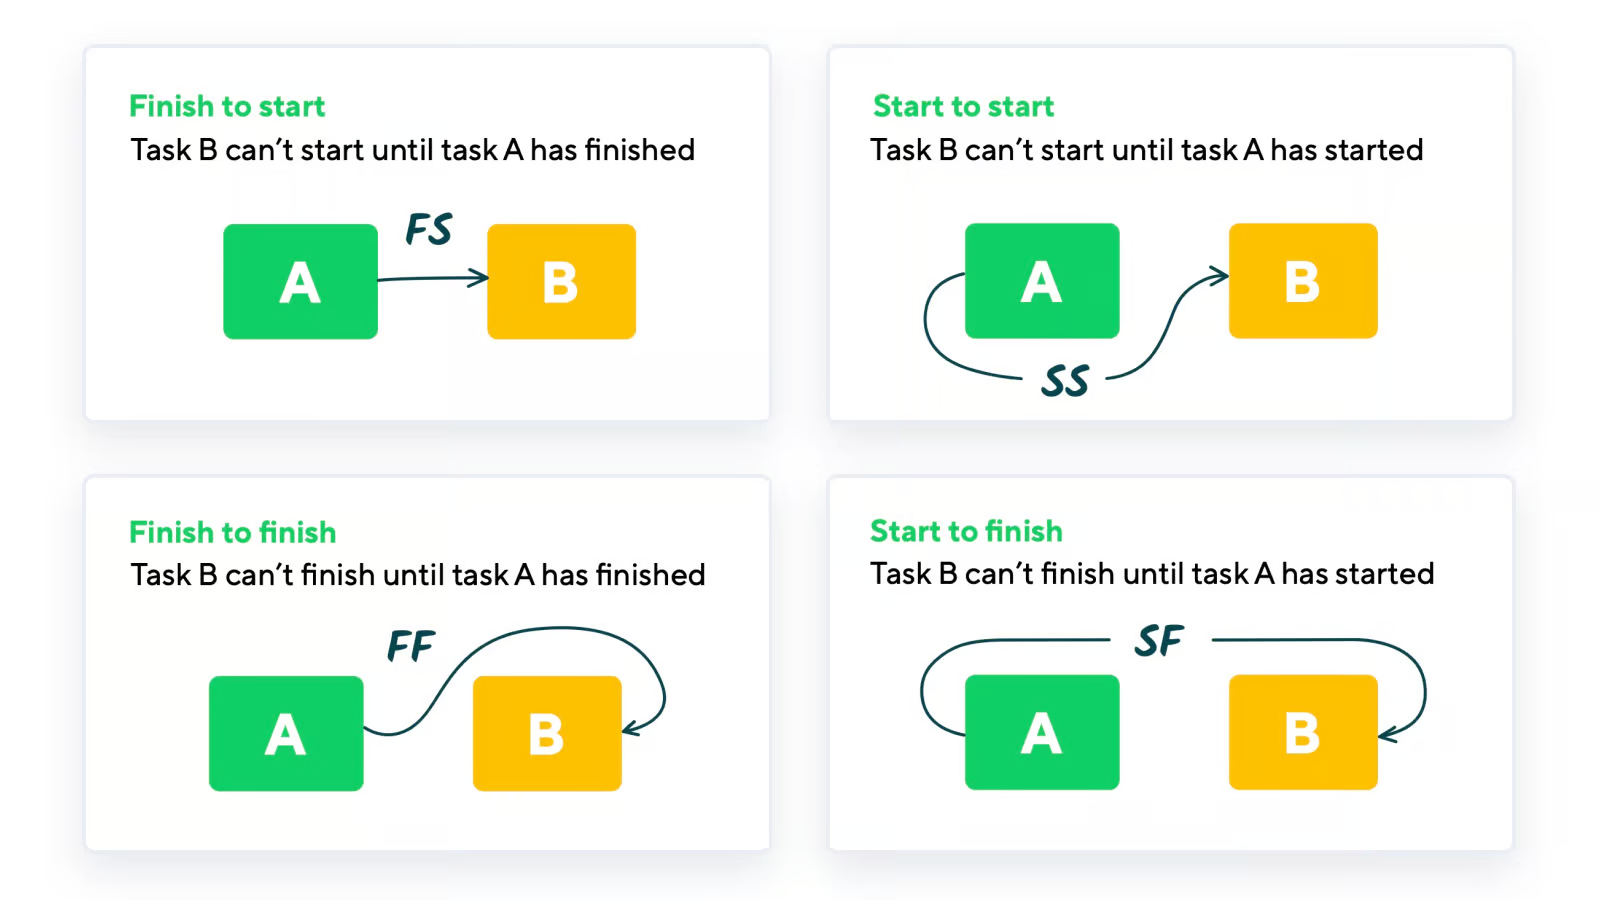
What are the four types of task dependencies Wrike supports?
Wrike supports finish-to-start (Task B starts after Task A completes), start-to-start (Task B starts when Task A starts), finish-to-finish (Task B finishes when Task A finishes), and start-to-finish (Task B finishes when Task A starts).
- Finish-to-start (the most common): Task B can’t start until Task A is completed. Your QA testing can’t begin until development finishes.
- Start-to-start: Task B can’t start until Task A starts. Your technical writer can’t begin documentation until the developer starts building the feature (even though both continue in parallel).
- Finish-to-finish: Task B can’t finish until Task A finishes. Your project closeout report can’t be finalized until client acceptance is finalized.
- Start-to-finish (rare but useful): Task B can’t finish until Task A starts. You’re maintaining a legacy system (Task B) that can’t be shut down until the new system goes live (Task A starts).
Lead and lag time for realistic scheduling
Dependencies rarely mean “the instant Task A finishes, Task B starts.” Real projects often have overlapping periods and require necessary buffers.
Wrike lets you add lead time where dependent work starts before its predecessor completes. For example, your QA team might begin testing two days before development finishes (lead time: -2 days) because they test completed modules while developers finish the last pieces.
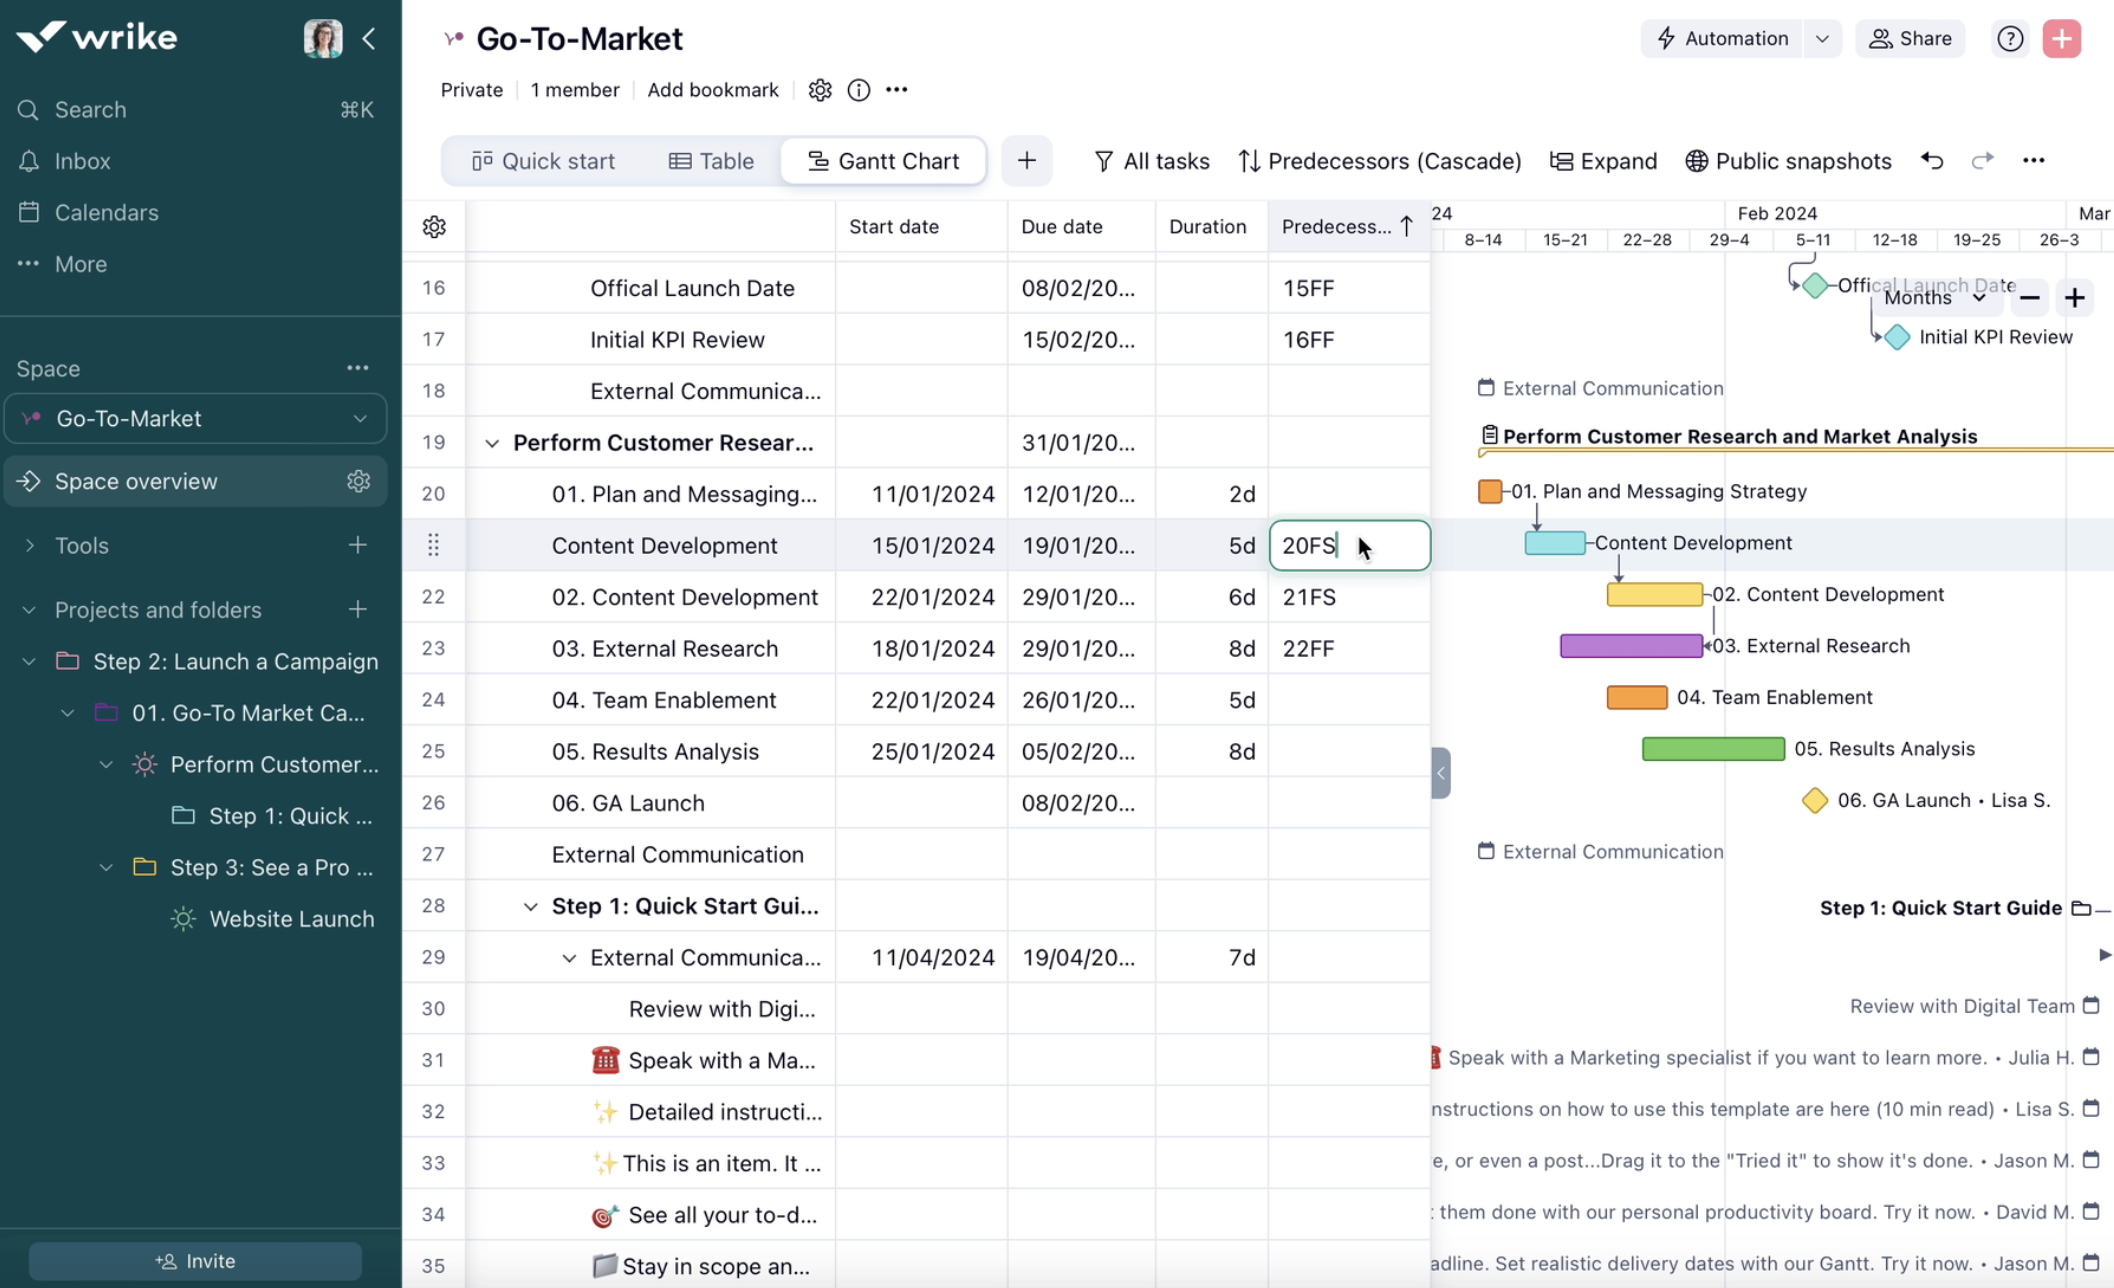
Or you add lag time — a buffer between tasks. Content approved on Monday might not be published until Thursday (lag time: +3 days) because you need time for final reviews, scheduling, and coordinator approval.
Without lead and lag support, project managers often create fake milestone tasks just to build in the required buffers. For example, “Design handoff” becomes an artificial task that exists only to create space on the timeline. With Wrike’s lead/lag parameters, your Gantt chart shows actual work — not spaceholders.
Automated dependency rescheduling
Wrike automatically recalculates dependent task dates when schedules change, eliminating the manual timeline updates.
Let’s say on Tuesday morning, your design team tells you the mockups will be three days late. Your development team was scheduled to start on Friday. Now they can’t start until Monday.
Other dependencies also get delayed. Your QA testing was scheduled to start the Monday after development. Backend integration follows QA. Security review follows integration. Staging deployment follows security. Production launch follows staging.
Wrike automatically recalculates and adjusts every dependent task in the chain. When you move the design task’s completion date three days later, development shifts to Monday, QA shifts to the following Monday, and integration, security, staging, and launch all cascade forward by three days.
This way, your timeline stays accurate without manual calculation.
Proactive conflict detection
Wrike’s conflict monitor identifies scheduling problems before they impact delivery, flagging impossible timelines.
Say you’re managing a product demo for a major conference on June 15. That’s your immovable milestone — the conference date won’t change, regardless of your project schedule.
Your dependency chain leading to that demo looks like this:
- Feature development → QA testing → Bug fixes → Demo preparation → Conference demo (June 15 milestone)
In week one, development hits a complexity issue and is extended by four days. Wrike’s automated rescheduling immediately cascades that delay forward: QA shifts four days later, bug fixes shift four days later, and demo prep shifts four days later.
But here’s the problem: that four-day delay now pushes demo preparation to finish on June 17. Your conference demo is on June 15. The automated rescheduling just created a timeline that’s physically impossible to execute.
The dependency arrow connecting them turns red to indicate the problem.
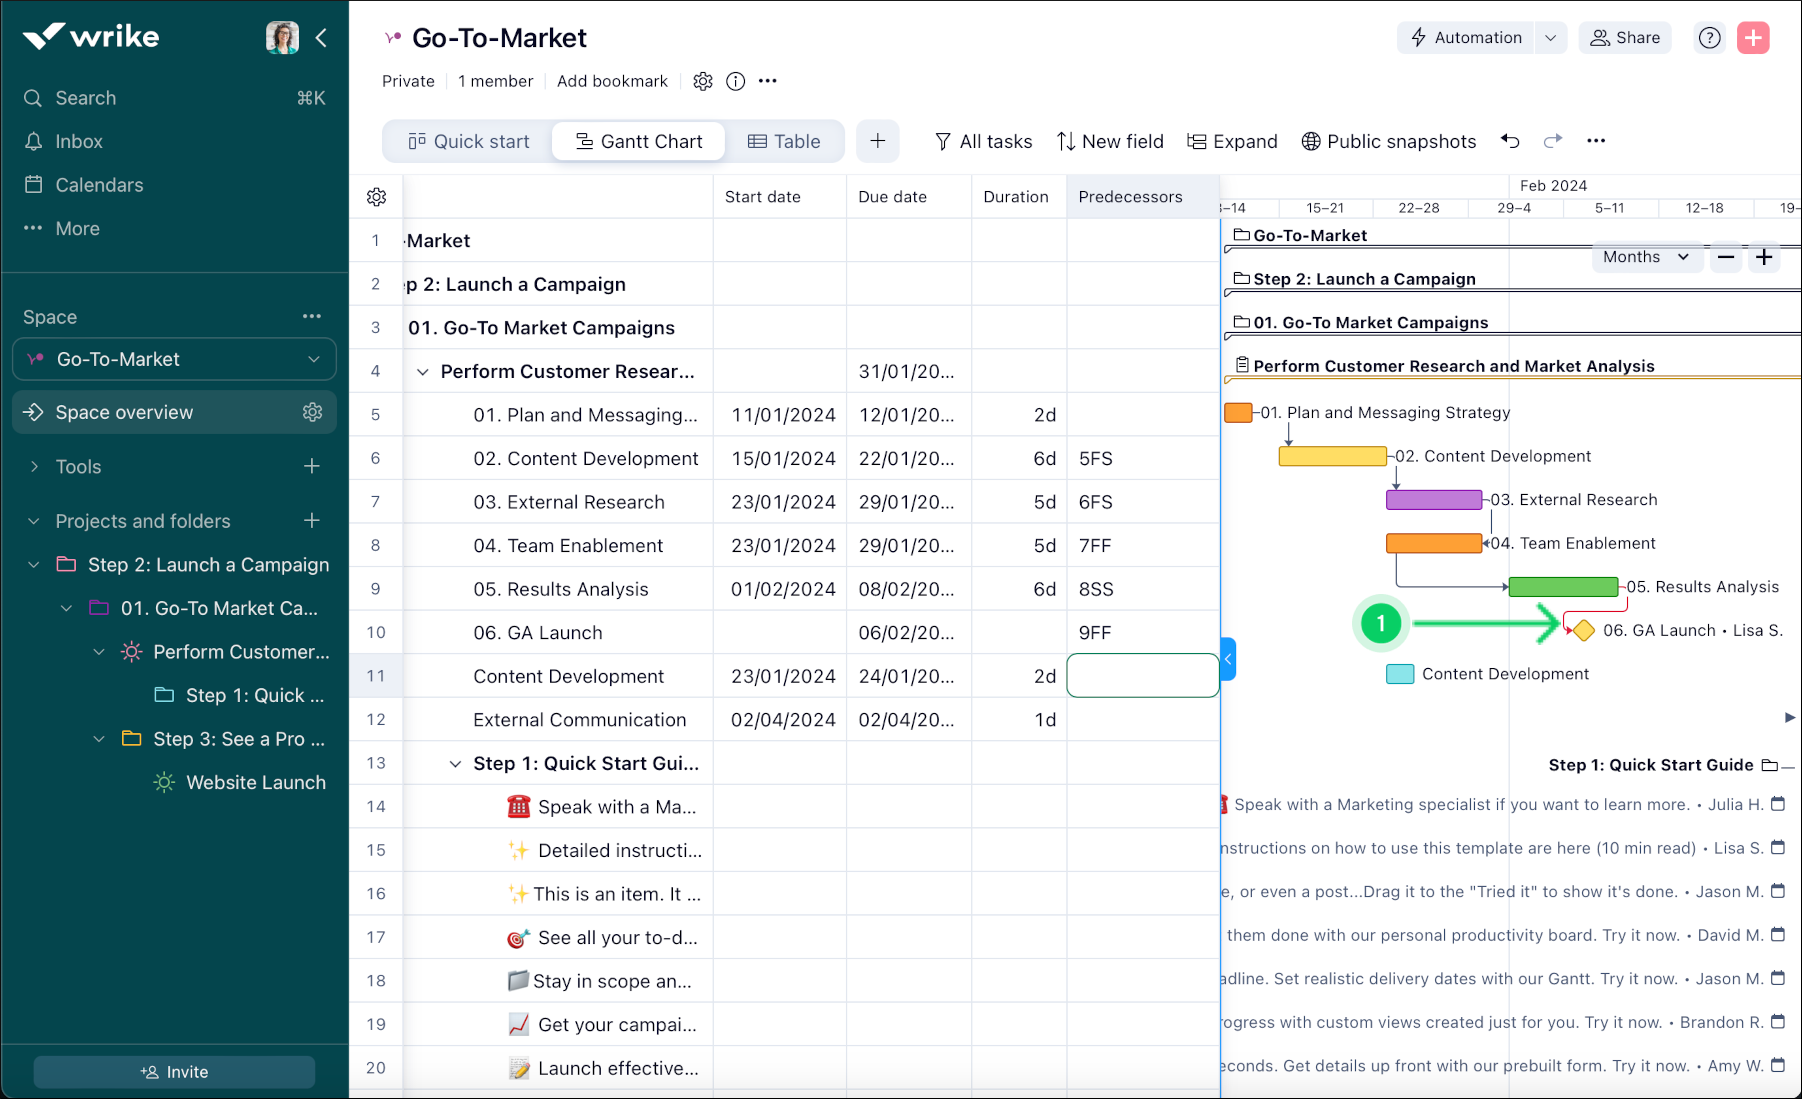
The red arrow appears in scenarios like:
- Finish-to-start conflict: The predecessor task is now scheduled to finish after the milestone date. Say your demo prep finishes June 17, but the conference milestone is June 15.
- Start-to-start conflict: A parallel task that must start when the milestone starts is now scheduled to finish after the milestone’s completion date. For example, if your marketing promotion must start when the conference starts, but marketing materials now finish after the conference date.
- Start-to-finish conflict: The successor task starts before the milestone date when it should start after. This is rare, but Wrike catches it.
This helps you to make an informed decision immediately — you can easily reschedule the milestone if it’s flexible, compress the timeline by accelerating work or bringing in additional resources, or adjust the dependency chain.
Blueprint templates for dependency workflows
Wrike blueprints let you save entire project structures — including all task dependencies as reusable templates. Let’s say you run quarterly product releases that always follow the same sequence:
Requirements gathering → design → development → QA → deployment
You can build this structure once in a blueprint. Each new release starts with all dependencies already mapped, automatically calculating realistic timelines based on your team’s capacity and the predecessor relationships you’ve defined.
How this helps:
- Unlike basic templates that just copy tasks, blueprints maintain the logic behind your project structure
- Dependency relationships stay intact even as dates adjust
- Custom fields, workflows, and approval processes carry over
- Teams can modify templates without losing the underlying dependency framework
This way, you move from planning to execution faster, with dependencies already mapped and timelines automatically calculated.
Resources view for capacity planning
Wrike’s Resources view shows how dependencies impact team capacity, letting you identify when dependency chains create resource bottlenecks before they derail your schedule.
Consider a product feature with five dependent tasks that must happen in sequence: architecture review, coding, code review, QA testing, and documentation. Your Gantt chart shows realistic durations and proper dependencies fitting neatly in your timeline.
But when all five tasks are assigned to the same senior engineer who also maintains legacy systems, handles customer escalations, mentors junior developers, and attends planning meetings, your timeline assumptions may break down. That engineer doesn’t have full-time availability for your feature, meaning tasks will take significantly longer than estimated.
The Resources view displays your team’s workload across time, showing all task assignments in one consolidated timeline.
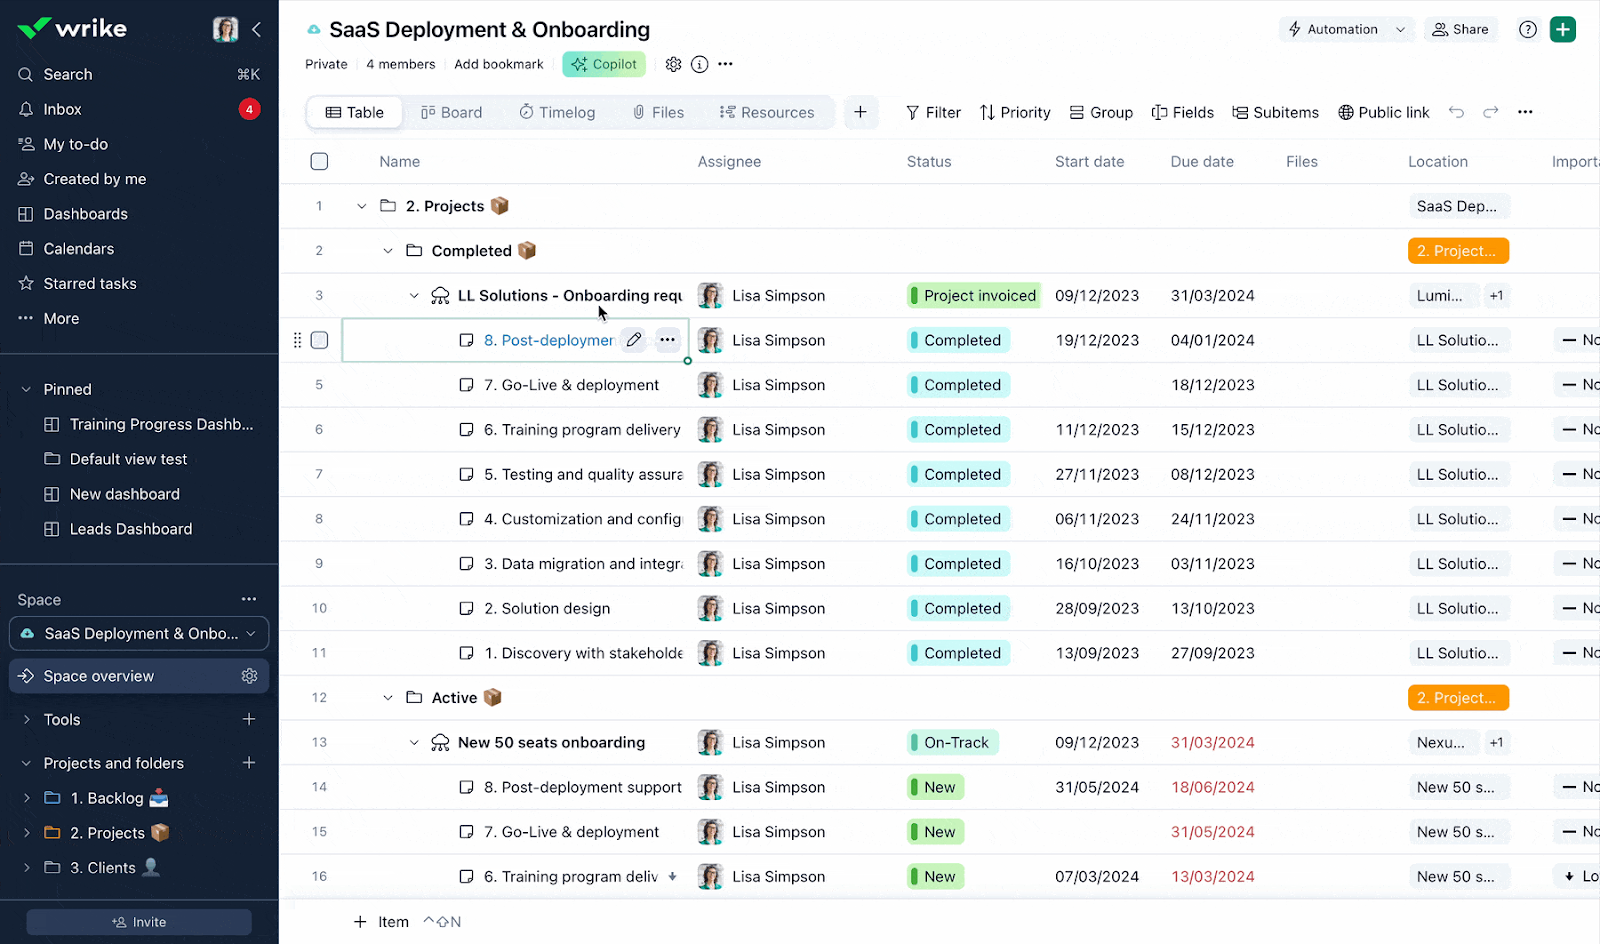
For your senior engineer, you’d see the five dependent feature tasks alongside their 20 hours of legacy system maintenance, customer escalations, mentoring time, and planning meetings. Color-coding immediately reveals when someone has more work scheduled than their available capacity allows.
Automatic critical path visualization
Not all dependencies are equally important. Some tasks have scheduling flexibility — they can start a day or two late without impacting your final deadline. Other tasks sit on your critical path, where any delay directly pushes your completion date back.
When you’re managing a project with 50 tasks and 30 dependencies, figuring out which tasks actually matter for your deadline requires manual calculation. You trace backward from your final deliverable, identifying which tasks feed into it, then which tasks feed into those, then which feed into those, until you’ve mapped the longest dependent task chain.
Most project managers don’t do this calculation. They often treat all delays equally, creating unnecessary urgency around tasks that have slack time while potentially missing early warning signs on tasks that actually threaten their deadline.
Wrike calculates your critical path automatically
Wrike analyzes your complete dependency structure and highlights the chain of tasks that determines your project completion date. This is your critical path — the sequence where any delay cascades directly to your deadline.
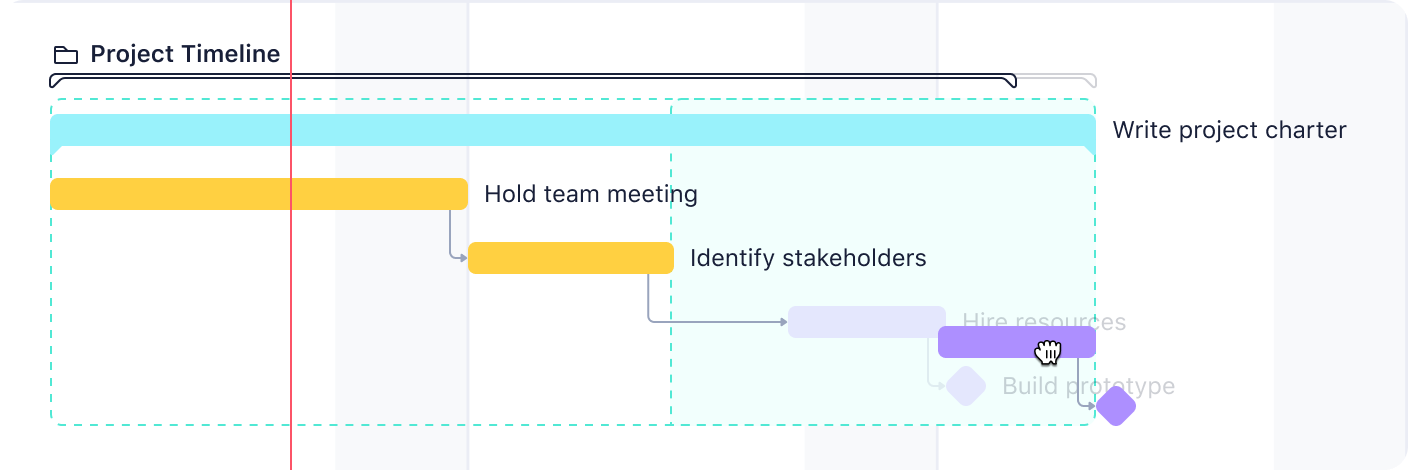
Let’s say you’re managing a product launch with two parallel workstreams: marketing materials and product development.
Both have internal dependencies. Marketing depends on brand guidelines feeding into design, design feeding into copywriting, and copywriting feeding into final review. Development depends on architecture decisions feeding into coding, coding feeding into testing.
Your Gantt chart shows all these dependencies clearly. But which delays actually matter?
Wrike’s critical path highlighting reveals the answer. This insight changes where you focus. Instead of treating all delays equally, you prioritize the bottleneck.
Resource allocation guided by critical path
The critical path also guides where you focus your best resources and where you accept some risk.
If your senior developer asks whether to work on backend coding (critical path) or help with frontend architecture decisions (not critical path), the critical path view gives you the answer: backend coding directly impacts your launch date, so that’s where you need your strongest developer focused.
If you’re deciding between adding an extra QA resource to the marketing review process (not critical path) or the product testing phase (critical path), the critical path view tells you where that resource has the most impact on your deadline.
This isn’t about ignoring non-critical tasks. It’s about making informed decisions about where delays matter most when you inevitably face tradeoffs.
Critical path changes as your project evolves
The critical path isn’t static. As work progresses and tasks are completed ahead of or behind schedule, the critical path can shift.
Perhaps your backend coding finishes three days early due to great execution. Suddenly, your frontend work has three days of slack time. But your marketing workstream just discovered a compliance issue that’s adding a week to the approval process. Marketing is now your critical path — it’s the longer workstream that controls your launch date.
Wrike recalculates your critical path continuously as task statuses update. You’re always looking at which dependencies currently matter most for your deadline, not which mattered most when you created the project plan.
Dependency management made easier with Wrike
Every tool has dependency features. The question is whether your tool actually solves the problems that dependencies create.
Does it prevent you from creating impossible timelines? Does it automatically maintain accurate schedules when changes happen? Does it show you which delays actually matter? Does it help you see resource bottlenecks before they impact delivery?
Wrike handles these challenges as built-in automation. Start a free trial to see how our dependency features work in your projects, or book a demo to discuss your specific dependency management challenges with our team.
Project management software with dependencies FAQs
What is a task dependency in project management?
A task dependency is a relationship between two tasks that determines the order in which they must be performed, ensuring tasks are completed in a logical sequence.
How does Wrike handle dependency changes automatically?
When one task’s schedule changes, Wrike automatically recalculates and adjusts all dependent task dates in the chain, eliminating manual timeline updates and keeping your project schedule accurate.
What is lead and lag time in dependencies?
Lead time allows dependent work to start before its predecessor completes, while lag time creates a buffer between tasks. Both help create realistic schedules without adding fake milestone tasks.
How does Wrike’s conflict monitor help prevent scheduling problems?
Wrike’s conflict monitor flags impossible timelines by turning dependency arrows red when automated rescheduling creates conflicts, such as when a predecessor task finishes after a fixed milestone date.
How do Wrike blueprints preserve dependency workflows?
Blueprints save entire project structures, including all task dependencies, as reusable templates, maintaining dependency relationships and logic even as dates adjust for new projects.
How does the Resources view help with dependency planning?
The Resources view shows team workload over time, with color-coding to reveal when dependency chains create resource bottlenecks, helping you identify capacity issues before they derail schedules.


