Key takeaways:
- Why do teams need project prioritization tools beyond simple to-do lists? As projects grow in scale and complexity, prioritization tools provide structured ways to evaluate importance, urgency, and resource availability. These tools help teams move from theory-heavy frameworks to real-world execution, ensuring decisions are aligned with goals, team capacity, and stakeholder input.
- How can prioritization tools support different frameworks like Eisenhower, RICE, or MoSCoW? Effective tools allow you to customize dashboards, workflows, and status fields to match the logic of any framework. Whether you’re categorizing tasks by urgency, calculating weighted scores, or incorporating cross-team feedback, the right platform adapts to your method without forcing you into a rigid system.
- What role do reporting and automation play in prioritization? Real-time reports and automated alerts help teams stay focused on the highest-value work. By tracking risks, progress, and dependencies, prioritization tools inform decisions as conditions change, making it easier to reprioritize quickly and keep high-impact projects on track.
If you’re facing a list of projects or project tasks you can no longer manage with a simple to-do list, you’re not alone. So many companies have wrestled with these issues that you’ll find a catalogue of famous project prioritization frameworks to help you get your workload under control.
The problem is, it’s easy to get lost in the theory. You could spend hours researching different models — like the Eisenhower Matrix, the RICE method, and the Kano model — and still be left scratching your head about how to introduce them to your team and apply them to your projects.
With this in mind, I’ve written this post to focus on software tools that keep your work organized, on schedule, and track for your strategic goals. Frameworks can define what to prioritize, but these are the practical tools you need to bring those strategies to life.
If you want to improve the way your team prioritizes its projects, you’re in the right place.
Project prioritization tools for any framework
The prioritization software I’ll talk about in this post:
- Tracks tasks and subtasks for a complete view of your project and a better understanding of your workload
- Monitors progress, not just workflow status, for better scheduling and delegation
- Shares your project plan with the entire team, so they can plan their work and reduce the time they spend waiting for updates
- Spots patterns in your work so you can improve your processes over time
- Tailors your approach so you can develop a method that works for you
Even the best prioritization techniques need strategies to keep your tasks in view, visualize your project progress in real time, and stay agile. Without them, it’s impossible to identify the most important tasks in your project — or make decisions about how to complete them.
Here, I’m going to focus on the project prioritization tools offered by our platform, Wrike.
Wrike is an all-in-one work management platform that supports your project management decisions with real-time data and shares them with your team. With tools like dashboards, custom reports, and inbuilt communications, you can take a structured approach to your decision making without being bound by a rigid prioritization framework.
Let’s take a closer look at how it works.
Monitor your tasks from intake to approval
The first step to prioritizing your project tasks is understanding the workload. That’s why Wrike’s complete work management system standardizes your approach from intake through the custom workflow stages and final approval.
When every task follows a process that’s built to track it, you get a live, bird’s-eye view of your progress and your project status. And when you can use that overview to keep yourself informed, you can be confident in the decisions you make to prioritize and delegate the work.

There are lots of ways to add tasks to your project in Wrike.
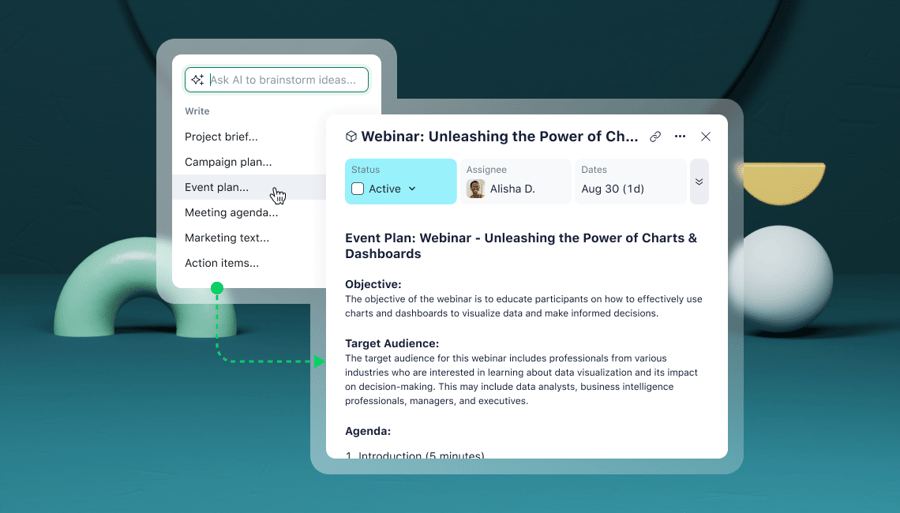
You can import them from information in Microsoft’s Excel, Outlook, or Project. You can create them from templates. You can use Wrike’s AI features to convert large items of work into actionable subtasks.
Or, you can set up custom request forms, which automatically kick off new tasks when they’re submitted by your clients.
However you choose to add tasks, once they exist in your Wrike space, the prioritization process can begin. I want to highlight that functionality now:
- By creating custom workflow statuses, you can describe the task’s importance as it moves through your process. Wrike’s most popular Business plan includes custom fields, workflows, and statuses, so you can show a task’s impact and level of priority in a way that makes sense for your team.
- With Wrike’s design tools, you can color-code your task statuses. This makes the project priorities clear at a glance in every one of the overviews you use.
- When you ask clients to submit tasks with request forms, you can include custom fields to gauge the level of priority, like a checkbox to mark urgent tasks or a date option for the requested deadline.
Most importantly, Wrike’s workflows can be automated from end to end. This removes the manual effort of organizing tasks, so you can continually prioritize your tasks based on the real-time information.
Whenever a task changes status, is marked urgent, or is assigned to a team member for the next workflow stage, you can set automatic, rule-based notifications to share the news with your team. With these same rules, Wrike can also adjust every view of your project — including your Kanban boards and Gantt chart timelines — to keep your roadmap up to date across the board.
Example: Ongoing monitoring, the Eisenhower Matrix, and Wrike
One of the best things about Wrike is its flexibility. While other apps might bind you to a particular way of prioritizing your tasks, Wrike helps you take what you like about those frameworks and build a system that gives practical support to your team’s day-to-day work.
If you’re wondering what all this looks like in practice, let’s break down an example of how Wrike’s prioritization tools could support a team using a version of the Eisenhower Matrix to inform the task management and time management strategies for their current project.
Eisenhower is a prioritization matrix that helps teams differentiate high-priority and low-priority tasks. It’s one of the best-known prioritization frameworks out there and also one of the simplest. Teams simply assign their tasks to one of four categories, usually visualized as quadrants:
- Important and urgent
- Important but not urgent
- Not important but urgent
- Not important and not urgent
Teams use this method to prioritize tasks because it’s streamlined, objective, and it helps them identify “quick wins” to keep up the team’s momentum.
You can support an Eisenhower overview in Wrike in two main ways:
- First, you can create four project folders to represent each quadrant, and assign incoming tasks to those folders. This helps you make sure you’re delegating the most urgent tasks first.
- Second, you can customize your team’s project management dashboard. Wrike dashboards include widgets that display live project data in clear diagrams and tables. By changing the filters on a widget, you can create and arrange four lists of tasks to represent each Eisenhower quadrant, almost as you would on a whiteboard.
Both of these strategies help you monitor progress on the most urgent, important tasks, and show you the tasks that could be postponed or deleted without affecting the project’s success.
Tailor your workspace for a 360-degree overview
I’ve already touched on Wrike’s dashboard and project timeline features. Just as with project monitoring features, those ongoing, real-time workspace overviews keep all your tasks in view. This helps you set the most effective priorities for your projects.
The beauty of a Wrike workspace is that you can set it up to view your work from multiple angles.
Wrike can display the tasks you’re tracking in Table view, showing who’s assigned to the task, when it’s due, and their percentage progress. At the same time, each task can exist on a team Kanban board, showing its workflow status. You’ll also find it on your shared Gantt chart, showing the dependencies between the tasks and their contribution to your project milestones.
And again, because of Wrike’s automation capabilities, whenever you update a task in one of these overviews, the others will mirror the change. 
Plus, Wrike’s workspace is completely scalable. If you have different projects to monitor, you can set up a macro-level, multiple-project dashboard for your managers or PMO. At the same time, on the micro level, you can create individual dashboards for every member of your team. These personal overviews show team members the tasks assigned to them, their upcoming deadlines, and their notifications. 
When you’re planning complex initiatives, this level of detail is indispensable.
Example: Value vs. impact matrices and Wrike
Value vs. impact is a core principle of several different prioritization methods. For example, the RICE method is a weighted scoring technique often used by product and software teams to balance customer needs and team capacity as they decide what features they’re going to work on next.
The RICE method is based on:
- Reach: The number of people who would be affected by a feature or a service
- Impact: How much the features contribute to the overall success of the product
- Confidence: How much you trust in the data that backs up your estimations
- Effort: How much work it will take to build a certain feature or complete a project
The RICE scoring model is:
(Reach x Impact x Confidence) / Effort
The higher the RICE score, the more important it is to make that feature a top priority.
Value vs. impact models are popular with Agile or sprint teams, but in comparison with the Eisenhower Matrix, they can be incredibly complex to manage. While effort is easily measured in the number of hours a feature will take to develop, for example, it can be tough to estimate the impact of a brand-new product, or to translate your confidence level into a percentage. And without project management software, product managers might simply lack the information they need to make their decisions.
Enter Wrike. The information in your workspace breaks down silos, visualizes your KPIs, and shows your performance over time. When it’s time to apply the RICE method to the tasks in your backlog, you can use this information to estimate the metrics you need more accurately and to reflect on what you learned the last time you prioritized your tasks in this way.
It’s also important to remember that Wrike’s overviews are connected. This means it’s easy to click through from your dashboard into the granular task status and task history data that’s been gathered as the task progresses through your workflow. If you’re still uncertain about how to prioritize projects after applying a value vs. effort matrix, Wrike makes it easy to find out more.
Prioritize multiple projects in one effective space
Wrike is more than a tool to prioritize tasks in a single project. It also works for portfolio managers who rank and prioritize entire projects when they’re making decisions about resource allocation.
We designed our tools to be completely scalable, to give an overview of the complex overlap between projects, and to streamline work that’s shared between teams.

A dashboard like the one above is a good example of what you can generate when you use Wrike’s portfolio management tools. Every widget on this dashboard gives vital information to support project prioritization:
- The total number of projects in progress: This is a representation of the team’s current workload. As well as showing the wiggle room in terms of capacity, this metric helps the manager decide whether to prioritize beginning new projects, or clearing those that are already in the pipeline.
- The overall completion status of the portfolio: In connection with the budget utilization, this metric is a good measure of the portfolio burndown, and whether the remaining projects can be completed with the resources remaining.
- The portfolio budget: By monitoring both the actual costs and the remaining budget, the manager can make an informed decision about whether to stick with their original budget allocation or adjust their approach, so as many high-priority projects as possible are completed to plan.
- The projects by owner: When they can view each team member’s workload and remaining capacity at a glance, the manager can quickly identify team members who might need support, especially if the most important or high-effort project tasks have been allocated to them.
- The number of overdue projects: This is an important risk management metric. By displaying it in the dashboard, the manager can monitor the situation and easily find out more about the projects that have gone off track.
Essentially, what Wrike provides here is a central source of truth for your wider project team.
It shows how each project and task contributes to the business goals, which helps managers to make decisions and share them with their teams. When this is all done in a shared location, it smooths the team collaboration and helps everyone understand the decisions that have been made.
Example: Wrike’s central source of truth and MoSCoW planning
The MoSCoW method is named for the four prioritization categories that define it. With this framework, planned features (or the tasks contributing to a project) can be classified as:
- Must have: These tasks are essential, and the project can’t be completed without them.
- Should have: These tasks would make sense for the project, and would be nice to have, but they’re not essential. For example, a product could still be launched without its “should-haves.”
- Could have: This is sometimes seen as a wish list — tasks that will be completed if the early stages of a project go well and there are still resources to spare.
- Won’t have: These tasks might be features that won’t be added to the current release, or tasks sent back to the sprint backlog for reasons of feasibility.
MoSCoW needs a lot of the same tools as the Eisenhower method I discussed earlier in this post, but there’s one crucial difference: While Eisenhower supports quick decisions within a small group, true MoSCoW is done with the wider project team.
This method recognizes that different stakeholders have varying levels of insight into the numerous aspects of a project, and it seeks to gather those insights actively before upcoming tasks are categorized.
For example, while a development team might be focused on improving existing features because they’re still not happy with them, a sales team might have heard from dozens of customers asking for the same new feature. Likewise, managers might be aware of wider threats to the company and concentrate on features that could keep up with competition, while marketers see ways to position a new release and want to highlight features that would give them a USP. All of these viewpoints have the potential to change the priorities the developers ultimately set.
When you work in Wrike, you create a central source of truth where all these different teams can track their work, update each other, and gather the evidence that supports the decisions they’re making.
With tools like shared dashboards and cross-tagging, you ensure that every team involved in a complex project sees how their work fits in. These tools and insights can help you rank projects in order of importance, especially if you’re using Wrike as a portfolio or PMO dashboard.
Use reports to identify urgent tasks
In some ways, project prioritization is a form of risk management. It’s a system to focus your energy on the most urgent tasks, while keeping up with the daily jobs that drive progress towards your goals. Even in their most basic forms, the methods I’ve discussed in this post minimize threats to your project and keep your team on track.
At the same time, the insights you gain from risk management tools are essential to the decisions you make when you prioritize your project tasks.
Risk management is an area where Wrike truly excels. Our reports and risk alerts are driven by the comprehensive task tracking data gathered as your project moves toward its goals. By filtering this data into reports, you get the regular, accessible insights you need to inform and optimize your approach.
- Send regular, automatically generated reports to your inbox. This saves time that would otherwise be spent compiling updates, and keeps you focused on your most valuable project tracking metrics.
- Automate risk alerts. Based on your project’s deadlines, task dependencies, the effort involved, and machine learning insights into your team’s past performance, Wrike alerts you when a task is at medium or high risk of missing its goals.
- Notify team members when tasks are at risk. With automated reminders and notifications triggered by risk alerts, team members can regroup and reprioritize their tasks quickly to get an at-risk project back on track.
- Update your stakeholders with custom reports. By tailoring your reports and notifications to your different stakeholders, you can keep them up to date on everything from the health of your project portfolio to the progress of your high-impact tasks without having to schedule a meeting.
All these features help you spot risks to your project as they emerge, which tells you exactly when it’s time to reprioritize. With Wrike’s tools, you can stay focused and adapt your plans before emerging issues derail your project work.
Better prioritization, better results
When you upgrade your project prioritization tools, you streamline your work, make the best use of your resources, and build toward better strategic alignment across your team.
Informed prioritization starts with Wrike. From multilevel overviews of your entire project to private dashboards to set individual priorities, Wrike gives you the tools you need to set and meet your goals, no matter what prioritization framework you choose.