September is here and, as the leaves start to fall, we’re raking in some of our most exciting product updates yet! If you’re looking to tidy up your inbox, access instant insights, or filter the information you see every day, we’ve got something for you.
We’ve also been watching last-minute registrations flow in for Collaborate 2025. If you still haven’t signed up to see world-renowned visionaries, inspirational change-makers, and leading product experts at work, make sure to register now. We can’t wait to see you on October 8/9!
Ready to see this month’s freshest features and most recent upgrades? Let’s get going!
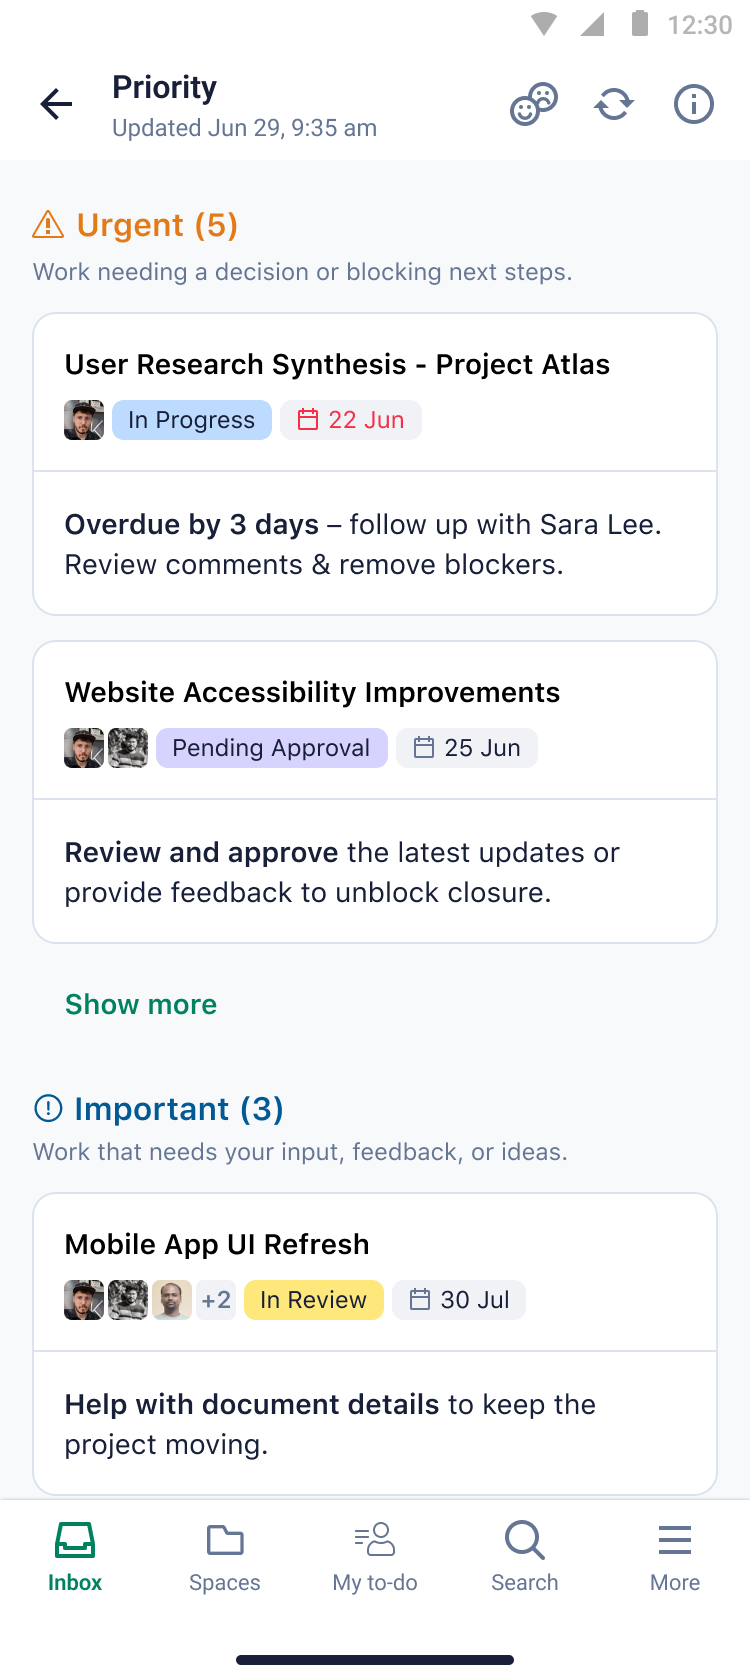
Gain control of your mobile inbox with AI
Do you dread opening your phone on a Monday morning? Getting blow-by-blow updates from an excitable colleague? Stuck in an interminable loop on a conversation about lunch options? If you’re battling an overflowing inbox, we have the perfect solution for you.
Our Wrike mobile apps now come with a clever AI-powered cleanup tool that can automatically detect and surface your most high-value messages. It can even deliver a handy summary digest and let you take quick actions directly from the preview screen. That means fewer distractions and more focus on the work that really matters.
If you want to stay up to speed with all things AI-related, check out our roundup blog post here.
Visualize your data your way with our AI widget generator
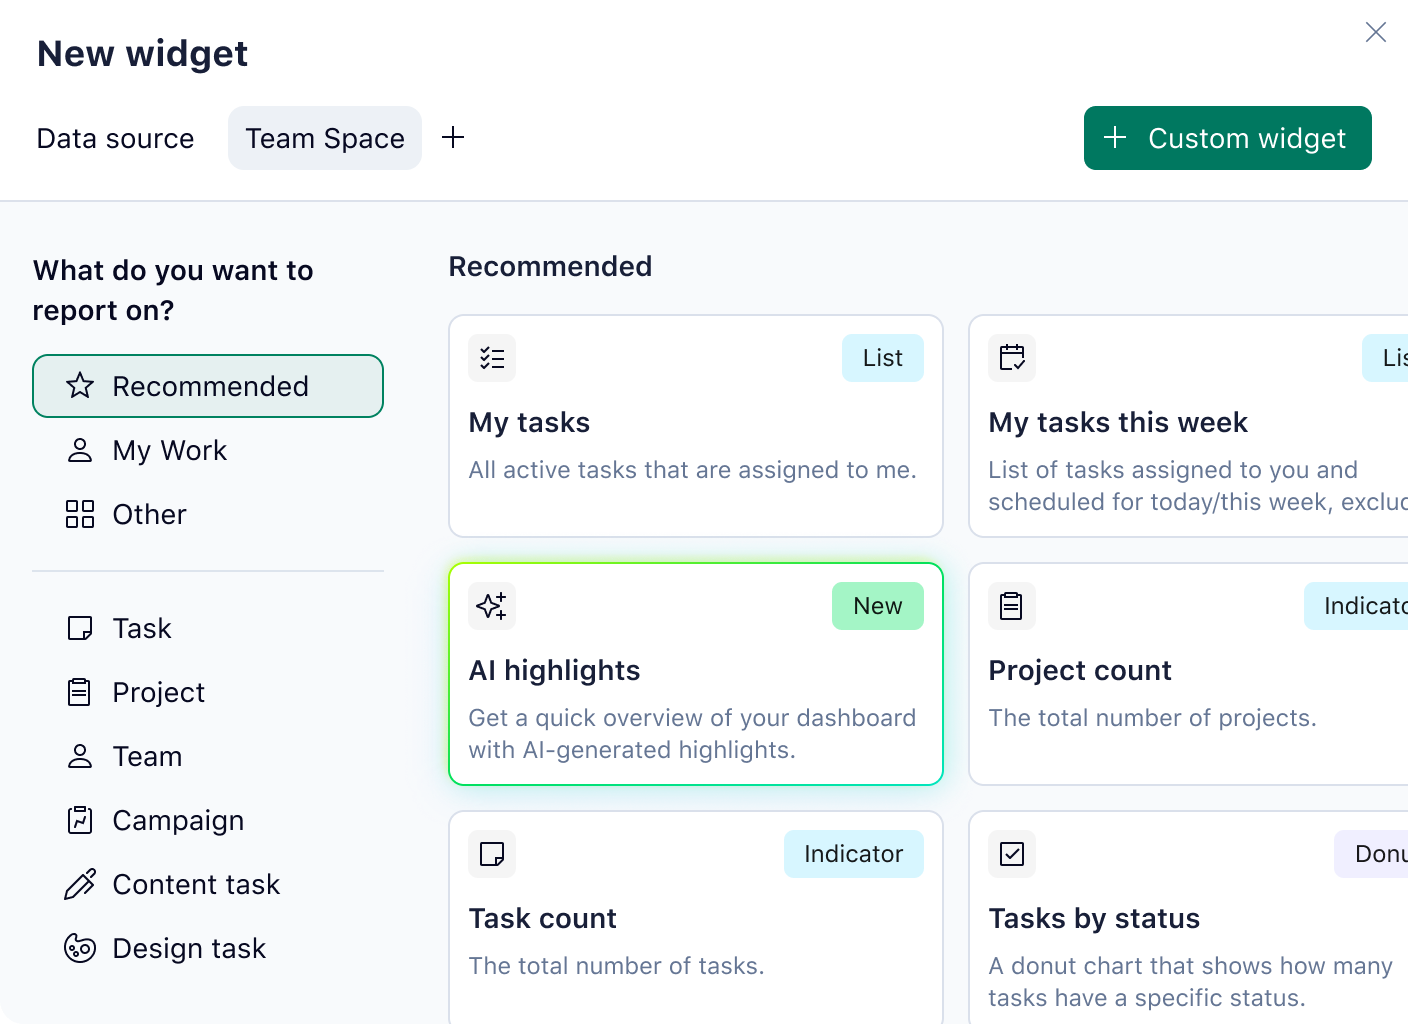
Remember when creating a widget took hours of configuration (and probably a panicked call to your IT team)? Those days are in the past now, thanks to our all-new widget generator, available to all Business and Enterprise accounts with GenAI enabled.
Now you can ask AI to create a custom widget that’ll show the data you need in almost any chart type (like bar, line, pie, etc.).
Here’s how simple it is:
- Go to your Dashboards tab.
- Click the + Widget button.
- Write a prompt using natural, normal language.
- Click “Create widget” and watch AI work its magic.
- Ta-da! It’s ready! Just click “Add to dashboard” to use it.
Fresh filters now available for dashboards
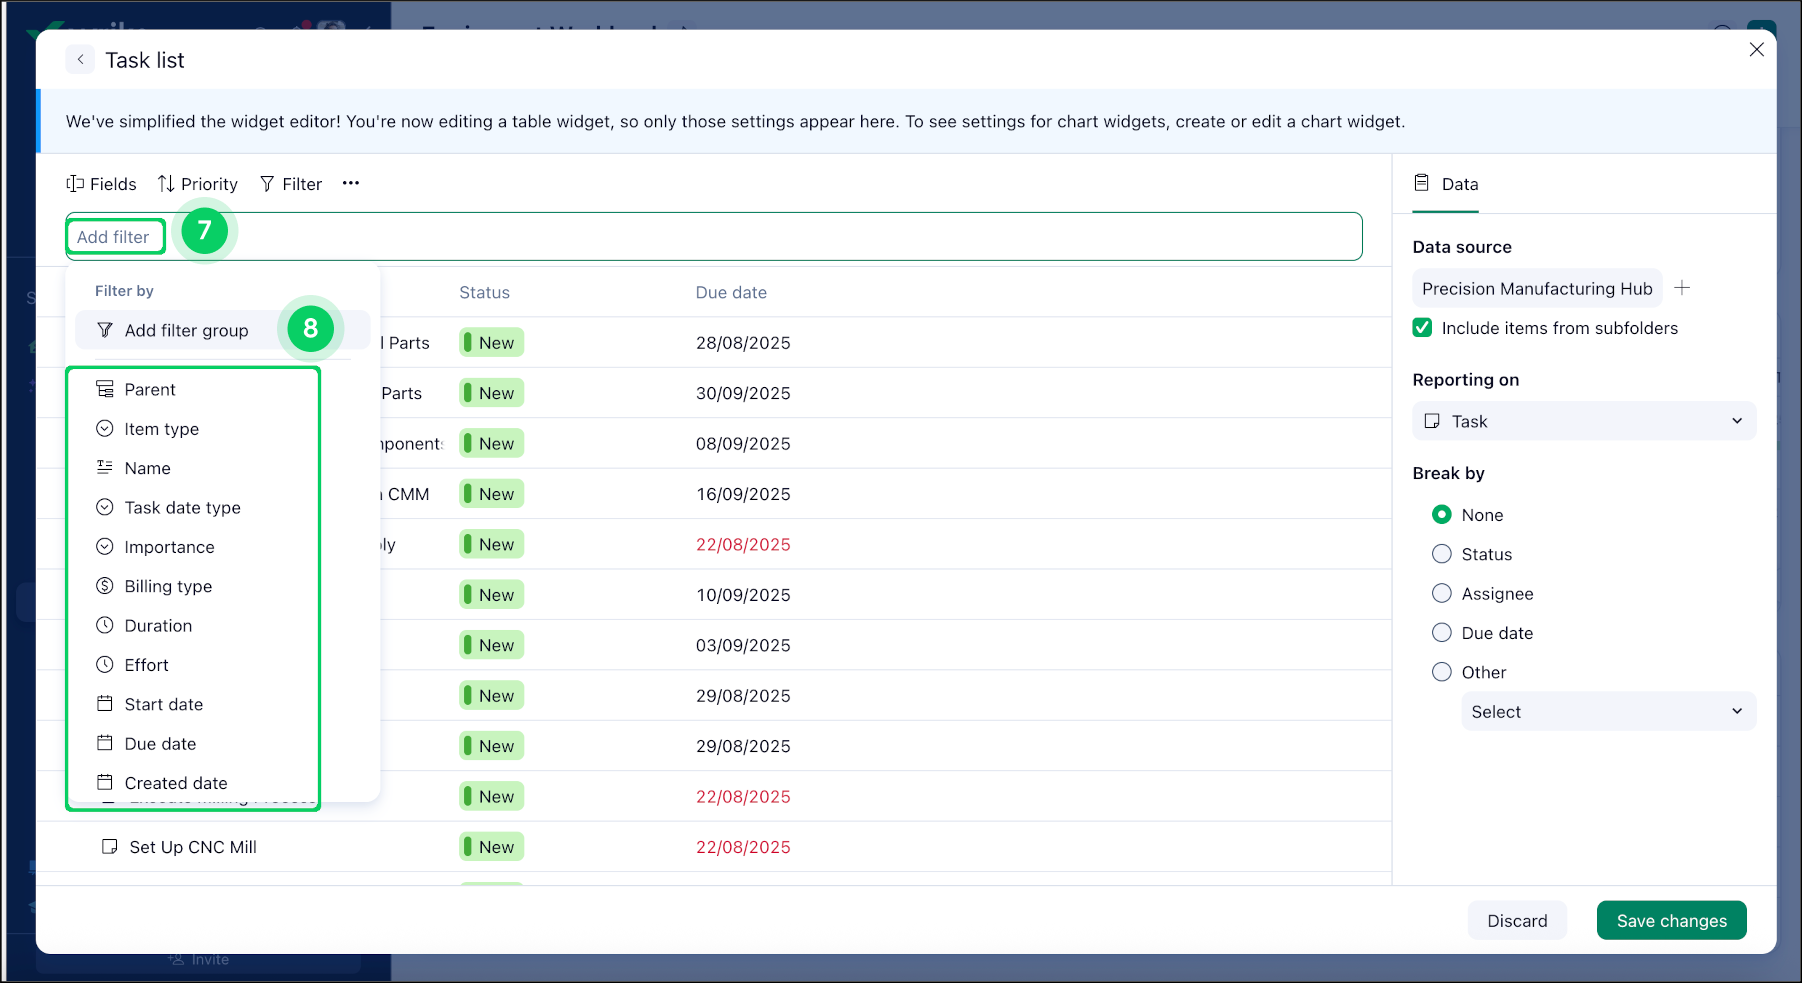
Want even more ways to slice and dice your data? We designed a new set of filters to give you more control over how you view the information you need. Choose between classic and new filter options for your dashboards, including:
- This/last/next year filter: View data by the current, previous, or next year to get an exact snapshot in time.
- Negative filtering: Exclude tasks you don’t want to see by using the “IS NOT” filter. For example, you might want to remove contractor-assigned work.
- Filter by name: Quickly find tasks by typing part of their name, and use prefixes or suffixes to narrow your search.
- Enhanced status filters: Break results down into specific statuses, such as “Active” or “Completed” — whatever workflow stage matters most to you.
- Calculated custom fields filtering: Visualize tasks using calculated custom fields to gain more detailed insights.
- Multiple filters on a single field: Add several filters to the same field (e.g., filter by multiple assignees at once).
- Parent filters: Filter tasks based on the properties of their parent tasks, which might allow you to capture more insights.
- And/or logic: Combine filters using AND (to match all conditions) or OR (to match any). You can also group filters to organize complex searches.
- Files filter: Find tasks that have files attached or no files attached — ideal for hunting down design assets fast.
Make onboarding easy with preconfigured dashboards
A couple of months ago, we introduced a feature that made it possible to deliver preconfigured dashboards that could get new hires, contractors, or clients started fast. Now, we’ve added the ability to create ready-made dashboards for entire user groups!
Admins can now set a dashboard as home for any group, such as “IT Support Technicians,” “Remote Team,” or “2026 Interns.”
This kind of “set-and-forget” scenario accelerates Wrike adoption for new users, ensuring that every new team member can access the information they need, instantly. It helps to level the playing field and unify work standards. It also saves valuable setup time — and lots of questions later!
If you want to learn the steps to creating your own home dashboard for user groups, visit our Help Center article titled “Creating User Group” and “Adding Users to User Groups.”
Get instant access to administrative data
This month, we released even more updates designed to make life simpler for admins, especially those managing large teams or complex workflows. A big part of that is delivering data that supports smart decisions. Here are three extra ways we’ve been working to empower teams to work faster and more efficiently:
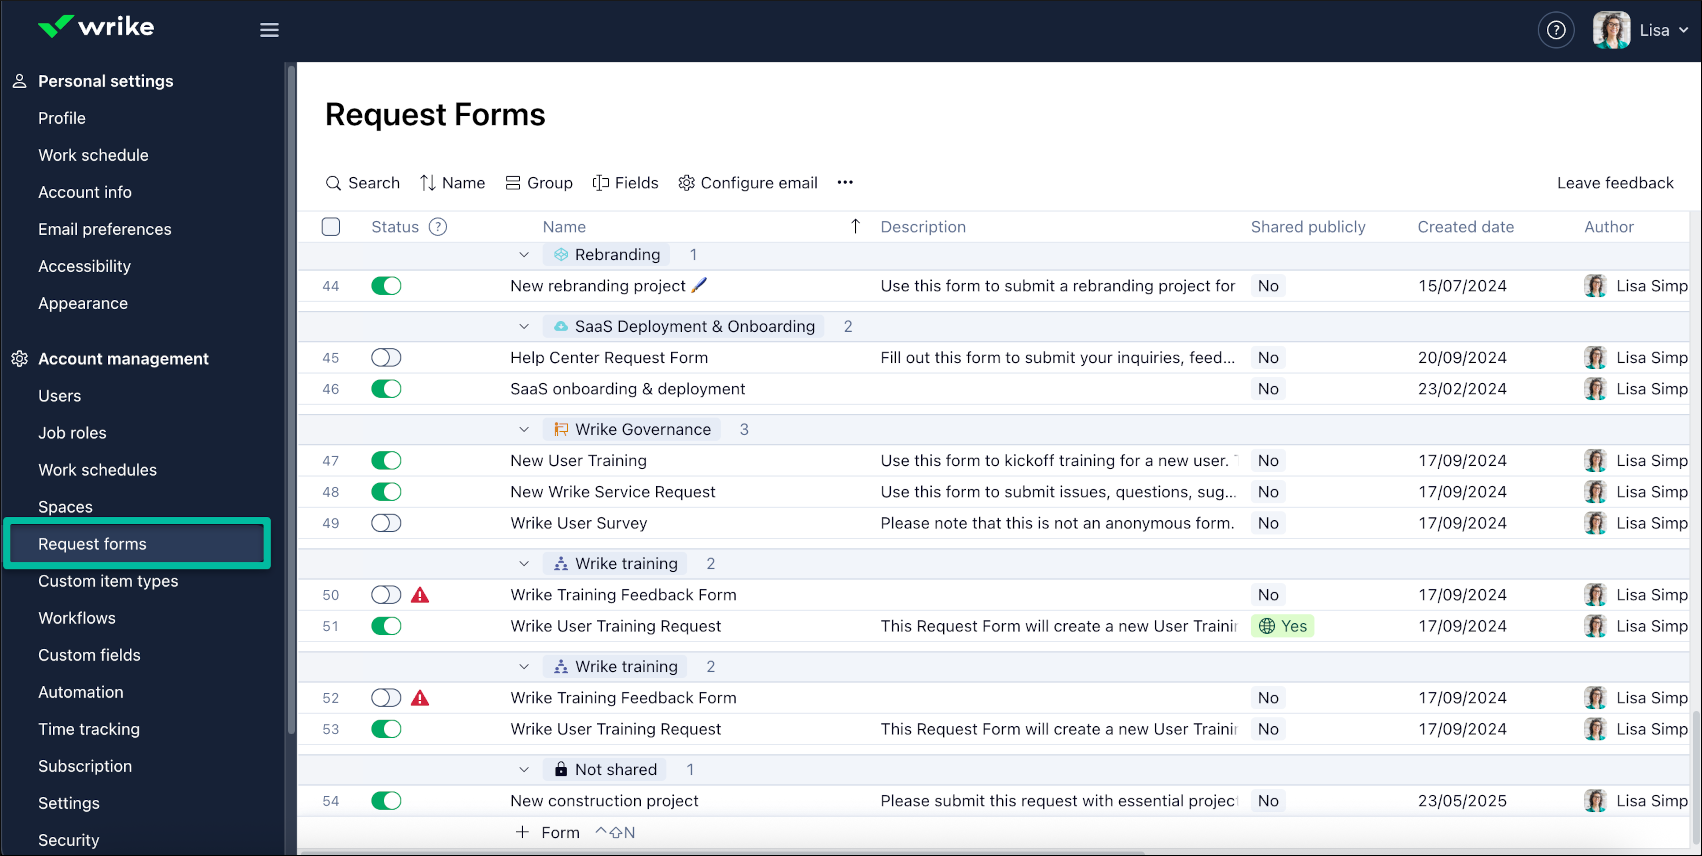
1. Track forms usage
If you’re an admin overseeing dozens of request forms across your organization, you know how complex its management can be. Wrike’s new forms usage data analysis helps you see how your forms are being used — instantly. Visualize detailed metrics like total submissions, who submitted the most recent request, and when each form was last used.
For example, if you notice that the “IT Equipment Request” form hasn’t been submitted in months, you can reach out to the IT team to see if the process has changed, or if updates to the form are needed. This data-driven approach helps you identify underused forms and make informed decisions that can speed up your organization’s workflows.
2. Export configurations to Excel
Working in an organization that still relies on Excel spreadsheets? You’re going to love our new feature that lets you export overviews of your spaces, forms, workflows, and custom item types directly into Excel — all in a couple of clicks.
This is a game changer for teams that need to regularly audit their workflows or deliver configuration data to leadership.
For instance, if you’re preparing for a quarterly review, you can quickly analyze which workflows are most active or spot inconsistencies across teams, and then present it via an Excel spreadsheet everyone can access.
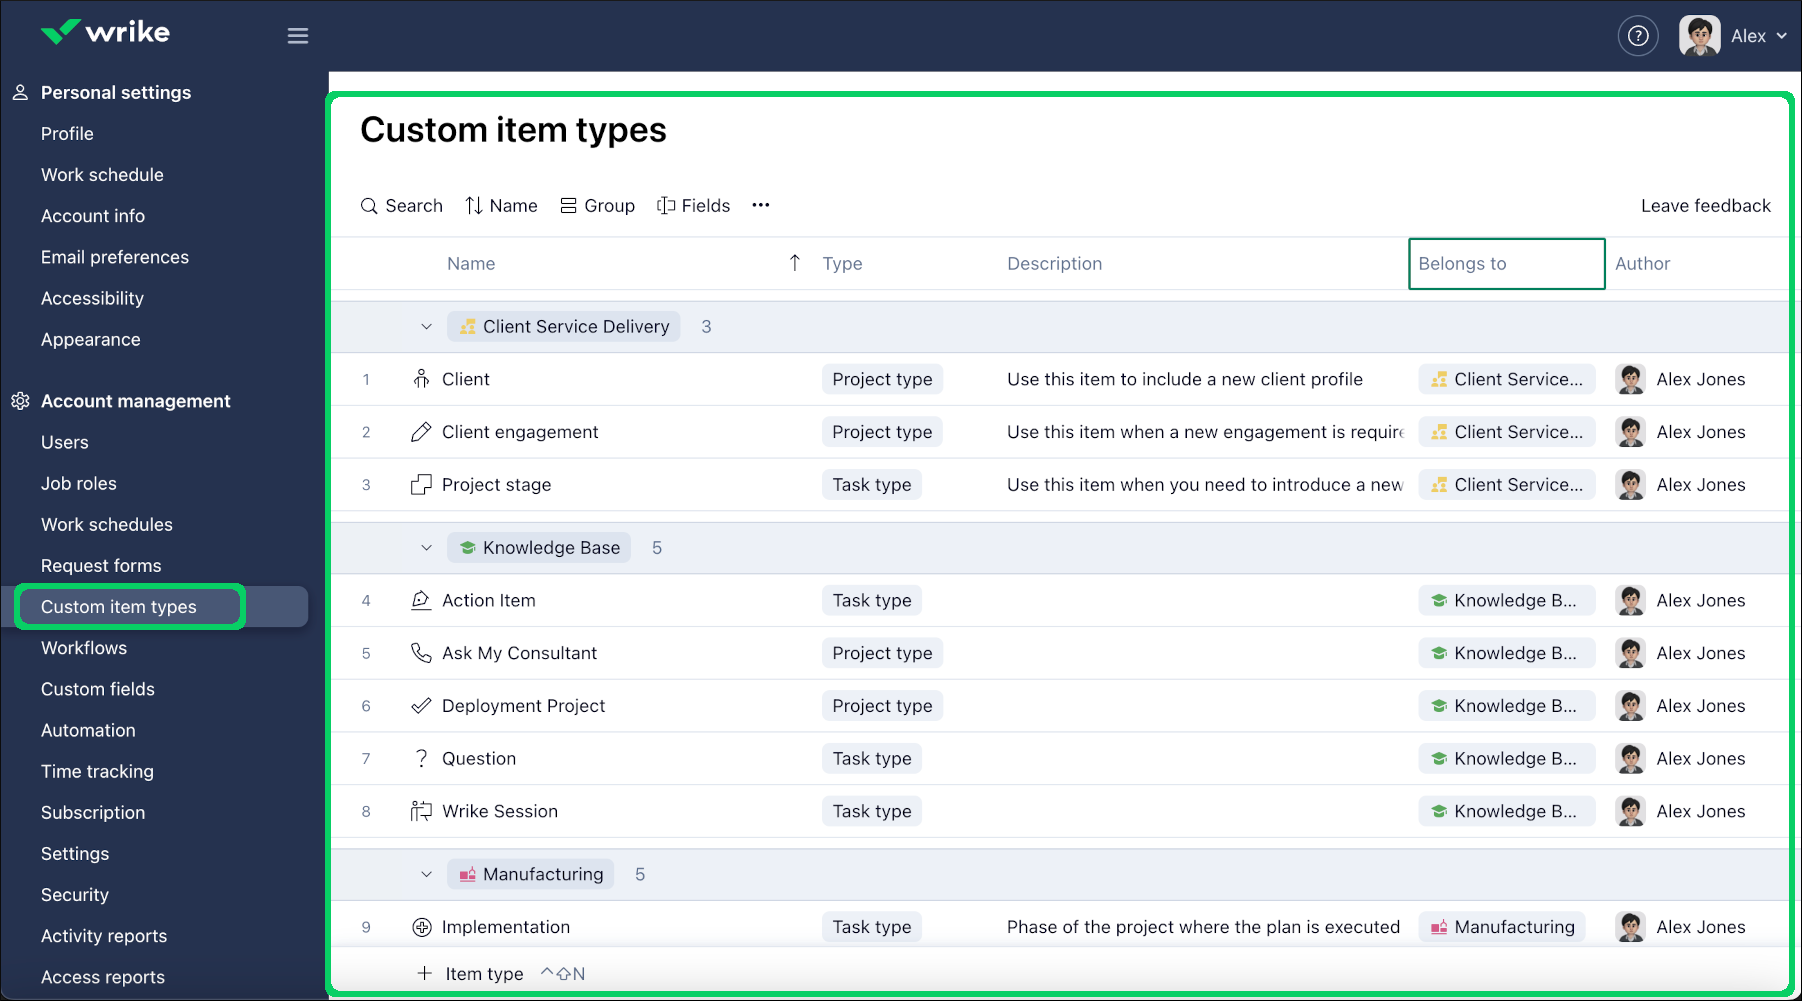
3. Analyze custom item types usage
Custom item types (CITs) are one of the most popular features in our platform, allowing Wrike customers to personalize their spaces and tailor their workflows. Understanding how CITs are used can help admins optimize workflows, which is why we’ve made it possible to track exactly how many have been created, how frequently they’re used, and who’s using them.
For example, your project management team might have introduced a “New Client Onboarding” item type, but your data shows it’s rarely used. You can follow up with team leads to find out why, or provide additional training to make sure everyone’s making the most out of the resources available to them.
All of these updates give admins greater visibility and control, making it easier than ever to create a workspace that really works.
If you’re interested in learning more about what we’ve been up to this September, check out our latest “What’s New in Wrike” video or read the full digest in our Help Center.
Make sure to pop by again next month, when we’ll have an extra-special set of updates — straight from the main stage of Collaborate 2025. Hope to see you there!


